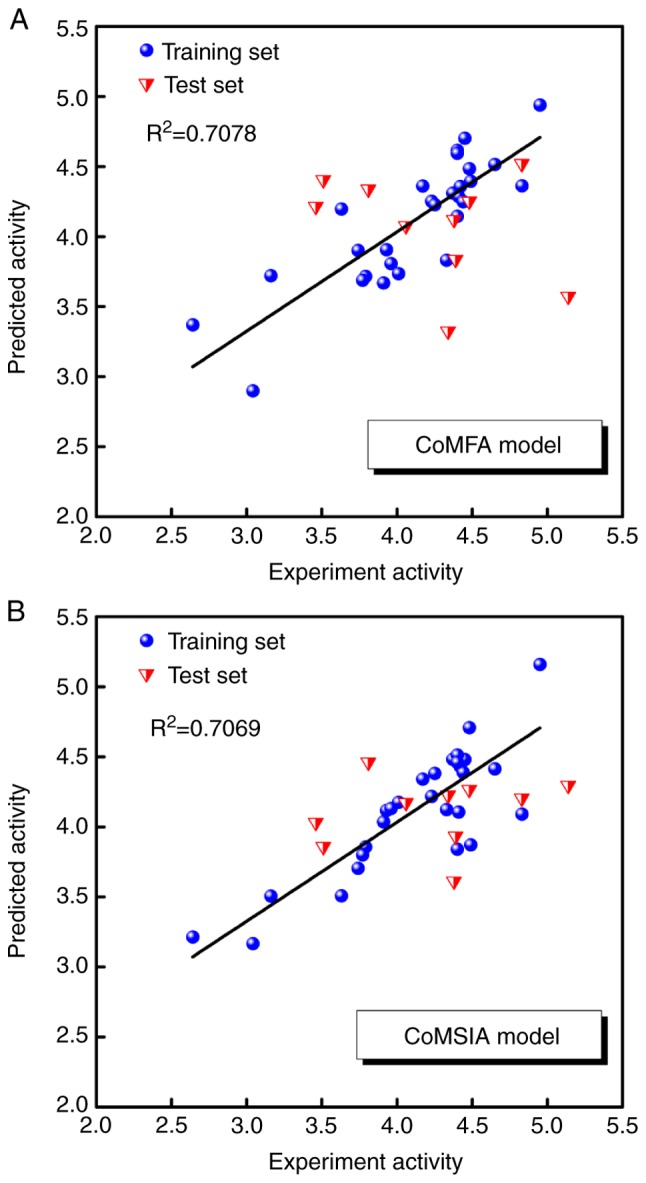
Figure 4.

Correlations between the predicted and experimental pIC50 values of the CoMFA and CoMSIA models. (A) CoMFA model and (B) CoMSIA model. CoMFA, comparative force field analysis; CoMSIA, comparative similarity indices analysis; IC50, half maximal inhibitory concentration; pIC50, −log(IC50).
