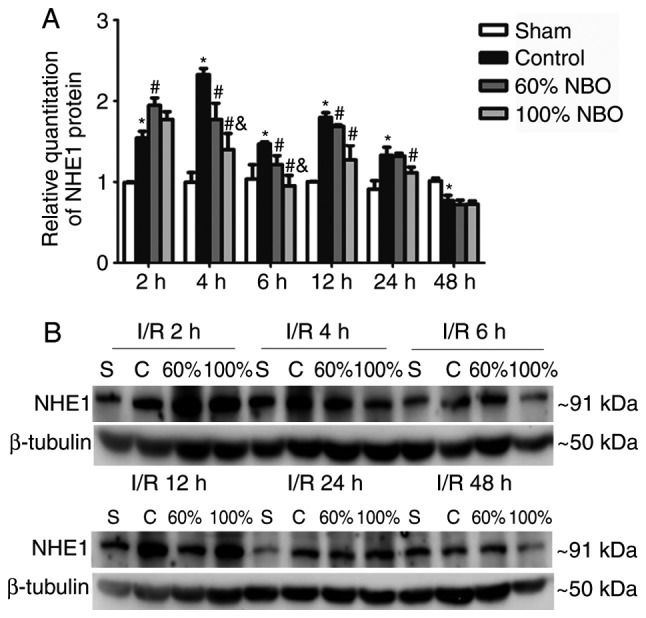
Figure 4.

Time course of NHE1 protein expression for the control and NBO treatment groups. (A) Quantification of NHE1 expression. (B) Representative photographs of western blot analysis of NHE1 in the ischemic brain during reperfusion at 2, 4, 6, 12, 24 and 48 h following the control and NBO treatment. Values are presented as the mean ± standard deviation, n=3 per group. β-tubulin was used as the loading control. *P<0.05 vs. the sham group; #P<0.05 vs. the control group; &P<0.05 vs. the 60% NBO group. NHE1, Na+/H+ exchanger 1; NBO, normobaric oxygen; S, sham; C, control; I/R, ischemic/reperfusion.
