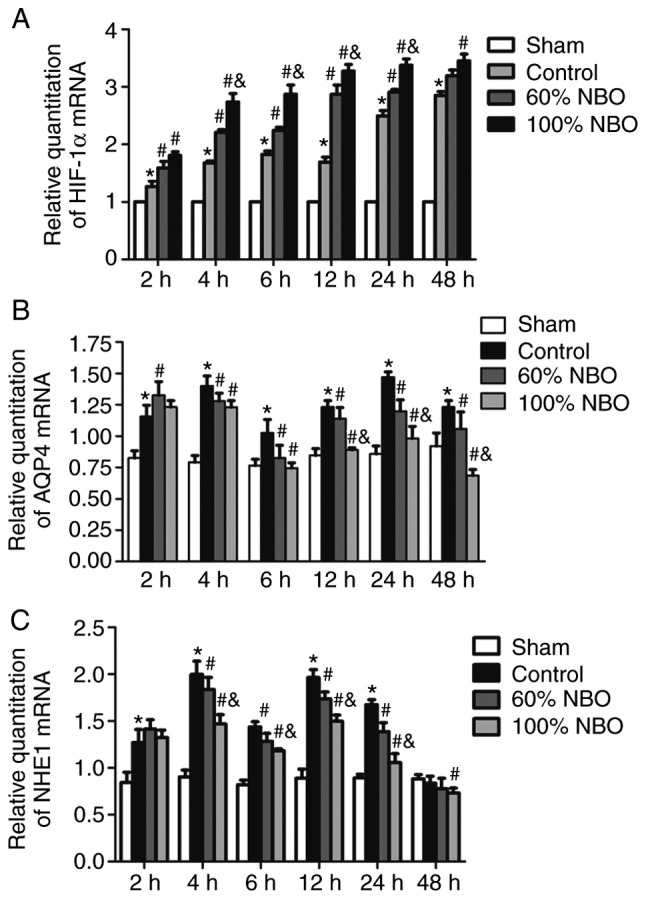
Figure 5.

The expression of (A) HIF-1α, (B) AQP4 and (C) NHE1 mRNA in the control and NBO groups at: 2, 4, 6, 12, 24 and 48 h. Bonferroni test following repeated measures analysis of variance. Values are presented as the mean ± standard deviation, n=3 per group. *P<0.05 vs. the sham group; #P<0.05 vs. the control group; &P<0.05 vs. the 60% NBO group. NBO, nor-mobaric oxygen; HIF-1α, hypoxia-inducible factor-1α; AQP4, aquaporin-4; NHE1, Na+/H+ exchanger 1.
