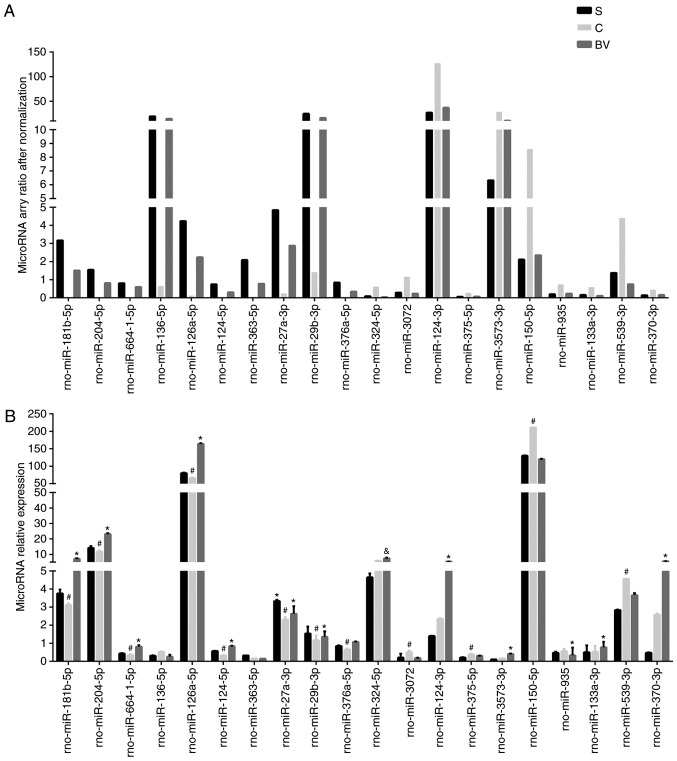
Figure 3.
qPCR validation of miRNA array. (A) Normalizing ratios of candidate miRNAs detected on the microarrays. (B) qPCR results of selected miRNAs. Results are presented as mean ± standard deviation (n=6). &P<0.05 group BV vs. group S; #P<0.01 group C vs. group S; *P<0.01 group BV vs. group C. qPCR, quantitative polymerase chain reaction; BV, biliverdin.

