
Figure 1: Effect of Mutational Load on Overall Survival after ICI Treatment.
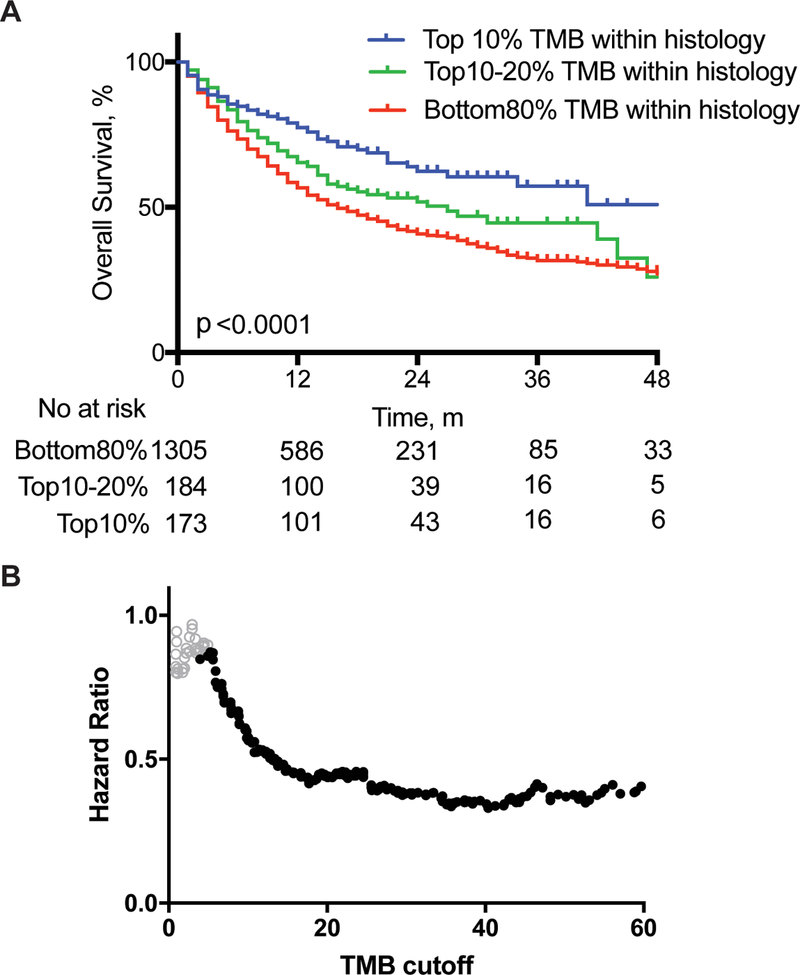
A. Kaplan-Meier curves for patients with tumors falling into the depicted deciles of TMB within each histology. Overall survival is from the first dose of ICI. Two-sided log-rank p value indicated for all patients, with univariate Cox regression hazard ratio of 0.76 (95% CI 0.62–0.94) and 0.52 (95% CI 0.42–0.64) for the 10–20% and Top10% groups, respectively, compared to Bottom80% group. m, monthsB. Cox regression hazard ratios for overall survival on 1662 patients, at depicted cutoffs of TMB across all cancer subtypes. Solid black circles represent hazard ratios with p-values <.05 (two-sided log rank p value).