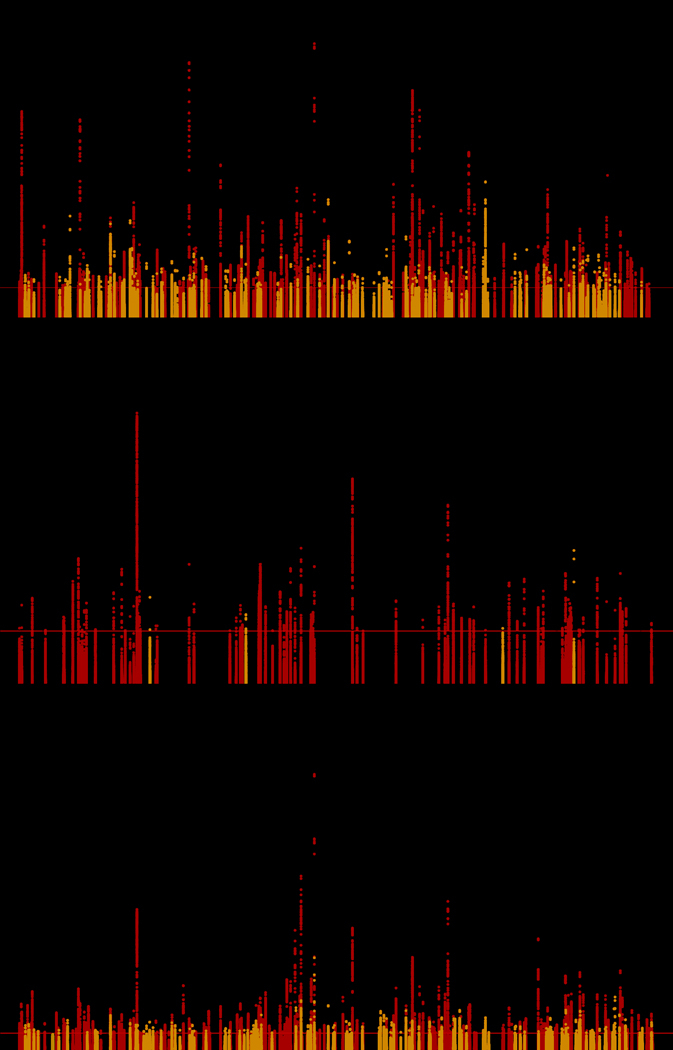
Figure 2. Manhattan plots summarizing discovery and replication meta-analysis for (a) SBP, (b) DBP, and (c) pulse pressure.

Manhattan plot of the discovery + replication meta-analysis. The y axis shows the –log10 P-values and the x axis shows the chromosomal positions. The horizontal red line represents the thresholds of P-value = 5 × 10⁻⁸ for genome-wide significance. SNPs in red are in previously identified loci (includes discovery only; Neff-max = 459,670 for SBP, 459,093 for DBP, and 459,305 for pulse pressure) whereas SNPs in orange are in novel loci (includes discovery + replication; Neff-max = 760,226 for SBP, 767,920 for DBP, and 759,768 for pulse pressure). All P-values are computed for associations between genotyped/imputed SNPs and blood pressure traits as dependent variables in multivariable adjusted logistic regression models. SBP, systolic blood pressure; DBP, diastolic blood pressure
