
Figure 3. Mapping blood pressure-associated genes to murine kidney cell type clusters for (a) SBP, (b) DBP, and (c) pulse pressure.
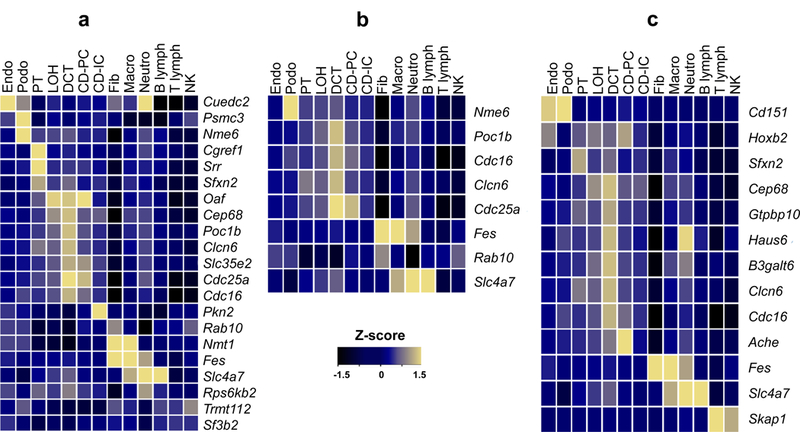
Average expression level of GWAS/eQTL defined genes in murine kidney cell types. Expression levels were determined in 43,745 kidney cells derived from seven mice. Mean expression values of the genes were calculated in each cluster. Color scheme is based on Z-score distribution obtained from two-sided Wald test. Z-scores are not corrected for multiple comparisons. Each row represents one gene and each column is single cell type cluster (as defined by Park et al.) on the heat map. Endo: endothelial, vascular, descending loop of Henle, Podo: podocyte, PT: proximal tubule, LOH: ascending loop of Henle, DCT: distal convoluted tubule, CD-PC: collecting duct principal cell, CD-IC: CD intercalated cell, Fib: fibroblast, Macro: macrophage, Neutro: neutrophil, NK: natural killer cell.