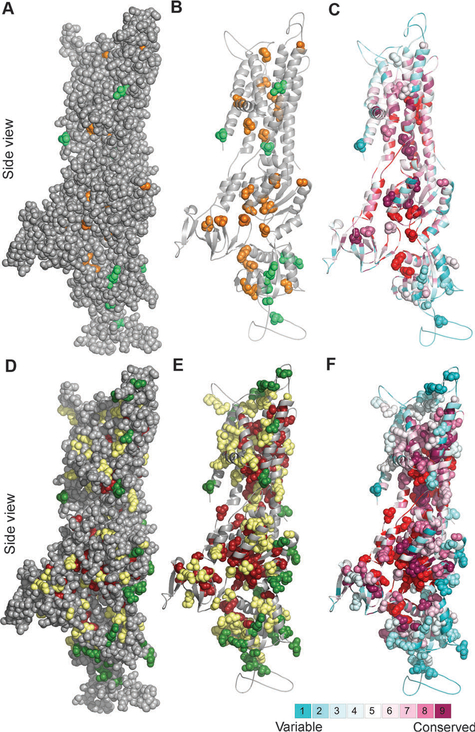
Fig. 2. Clinically-detected mutations in light of structure and conservation.
Side view of the ATP7B model with the cytoplasm below. (Panels A–C) Location and conservation of clinical missense mutations,7 for which experimental data are available (Table S1, ESI†) (A) Positions sensitive and non-sensitive to mutation are colored orange and green, respectively. The model (in gray) is shown as spheres, demonstrating which of the experimentally assessed positions are buried in the protein core. (B) Same as in panel A, with only the positions sensitive and non-sensitive to mutation in experiment shown as spheres. (C) As in panel B, with the structure colored by ConSurf analysis (Fig. 1A), and the PatchFinder patch (Fig. 1C) colored red. Most sensitive-to-mutation positions map to conserved residues, either buried or part of the functional site, whereas the less sensitive positions tend to be less conserved and more accessible. (Panels D–F) Location and conservation of all clinical missense mutations7 (D) Green and dark red coloring indicate positions suggested by our analysis to be sensitive and less sensitive, respectively, positions for which the effect was not proposed are shown in yellow. (E) Same as panel D, showing only the clinical missense mutations as spheres. (F) Same as panel E, with the coloring scheme corresponding to the ConSurf and PatchFinder analysis.

