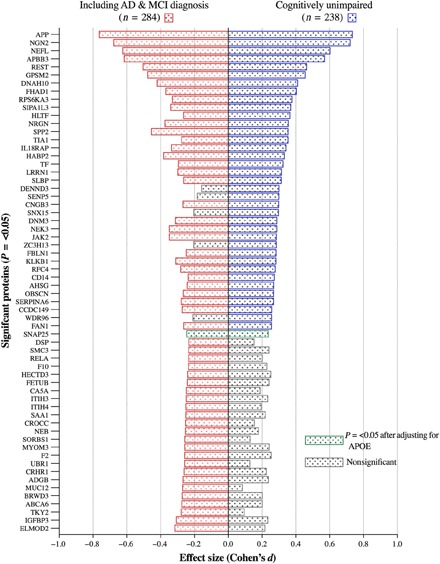
Fig. 1. Pyramid plot to display the effect sizes (Cohen’s d) of protein significantly (P = <0.05) associated with Aβ burden (Aβ− versus Aβ+).

On the right are proteins associated with cognitively unimpaired individuals and the association with the addition of individuals with MCI and AD on the left. Gray bars illustrate a nonsignificant effect size.
