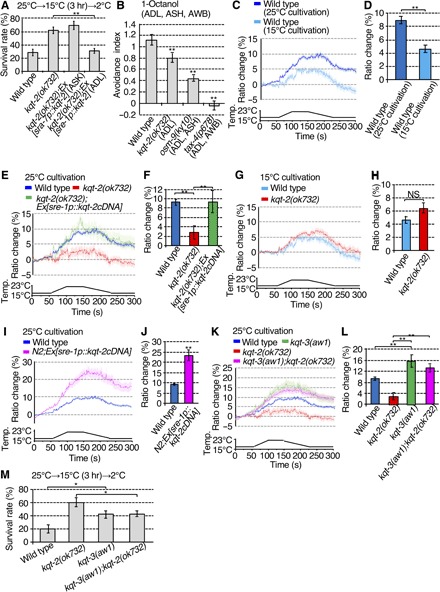
Fig. 2. KQT-2 in ADL neurons is necessary for cold acclimation and a Ca2+ response in response to temperature stimuli.

(A) Abnormal kqt-2(ok732) cold acclimation was rescued by expressing kqt-2cDNA in ADL, not ASK neurons. Number of assays ≥ 18. Error bar indicates SEM. Comparisons were performed using the Tukey-Kramer method. *P < 0.05, **P < 0.01. (B) Avoidance behavior against 1-octanol received by ADL, AWB, and ASH sensory neurons. Number of assays ≥ 9. Error bar indicates SEM. Comparisons were performed using Dunnett’s test. *P < 0.05, **P < 0.01. (C to L) Ca2+ imaging of ADL neurons in animals cultivated at 15° or 25°C in response to temperature stimuli from 17° to 23°C. The graphs indicate the change in yellow fluorescent protein (YFP)/cyan fluorescent protein (CFP) ratio in response to temperature stimuli. The bar graphs indicate the average change in ratio from 160 to 170 s (D and H) or from 170 to 180 s (F, J, and L). (C and D) In vivo calcium imaging of ADL neurons in the wild type cultivated at 25° or 15°C. n ≥ 16. (E and F) The responsiveness of ADL neurons to temperature change is abrogated in the kqt-2 mutant and restored by ADL-specific expression of kqt-2(+). n ≥ 18. (G and H) In vivo calcium imaging of ADL neurons in the wild type and kqt-2 mutant cultivated at 15°C. n ≥ 16. (I and J) Overexpression of kqt-2(+) in wild-type ADL neurons increases Ca2+ response to temperature stimuli. n ≥ 25. (K and L) Increased Ca2+ response in ADL neurons in kqt-3(aw1) and kqt-3(aw1);kqt-2(ok732) mutants. n ≥ 16. (D, H, and J) Error bar indicates SEM. Comparisons were performed using the unpaired t test (Welch). *P < 0.05, **P < 0.01. (F and L) Error bar indicates SEM. Comparisons were performed using the Tukey-Kramer method. *P < 0.05, **P < 0.01 NS, not significant. Analysis by two-way analysis of variance (ANOVA) confirmed that there was a significant effect of the kqt-2 genotype (P = 0.042) and also a significant effect of the kqt-3 genotype (P = 2.20 × 10⁻⁸), but there was no significant interaction between kqt-2 and kqt-3 genotypes (P = 0.133; see Supplementary raw data file). Data of wild-type animals cultivated at 25°C, shown in (C), are shared with (E), (I), and (K), Figs. 3 (D, F, and H) and 4D, and fig. S6A, given that the experiments were conducted simultaneously (C, E, I, and K). Data of wild-type animals cultivated at 15°C, shown in (C), are shared with (G), given that the experiments were conducted simultaneously (C and G). Data of kqt-2(ok723) cultivated at 25°C, shown in (E), were shared with (K) and Figs. 3H and 4D, given that the experiments were conducted simultaneously (E and K). (M) Epistasis analyses of cold acclimation in kqt-2 and kqt-3 mutants. All mutant strains exhibit supranormal cold acclimation, but the kqt-3(aw1) cold acclimation phenotype appears epistatic to kqt-2(ok732). Number of assays ≥ 12. Error bar indicates SEM. Comparisons were performed using the Tukey-Kramer method. *P < 0.05, **P < 0.01.
