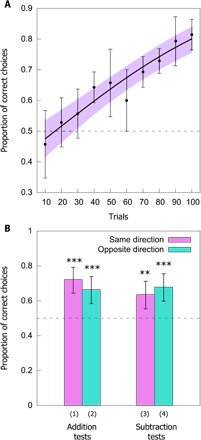
Fig. 2. Results of the learning and testing phases.

(A) Performance during the learning phase. Dashed line at 0.5 indicates chance level performance. Solid black line represents a function describing the learning phase of n = 14 bees as modeled by a generalized linear mixed-effect model (GLMM). Points (closed circles) along the curve indicate the observed mean ± 95% confidence intervals (CIs) (purple) of correct choices for the bees. Increase in performance during the learning phase was significant. (B) Performance during the testing phases for addition and subtraction. Pink columns (left) show results when the incorrect answer was in the same direction as the correct answer, and blue column (right) show results when the incorrect answer was in the opposite direction as the correct answer. Numbers under columns (1, 2, 3, and 4) correspond to the operations in the main text. Dashed line at 0.5 indicates chance level performance. Significance from chance level performance is indicated by *P < 0.05, **P < 0.01, and ***P < 0.001. Data shown are means ± 95% CI boundaries for all tests.
