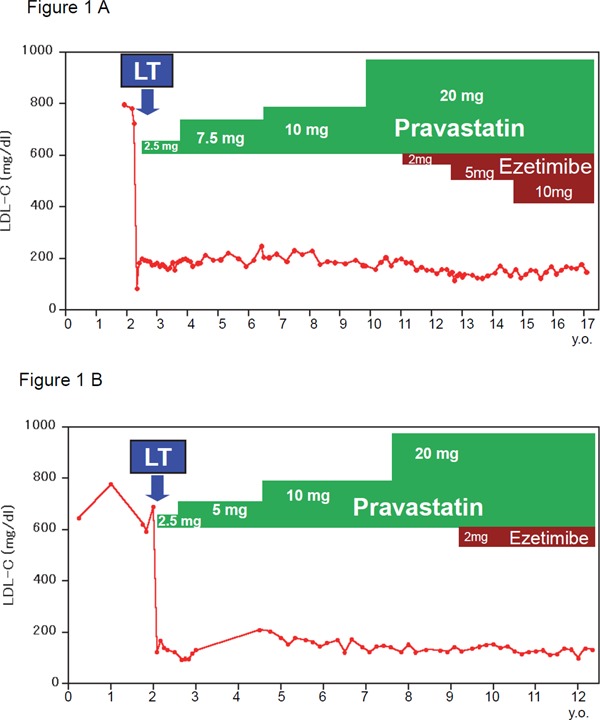
Fig. 1.

Time course of lipid profiles and lipid-lowering medication.
(A) Elder sibling, male; (B) younger sibling, female.
Line plot showing plasma LDL-C levels.
LT; liver transplantation.

Time course of lipid profiles and lipid-lowering medication.
(A) Elder sibling, male; (B) younger sibling, female.
Line plot showing plasma LDL-C levels.
LT; liver transplantation.