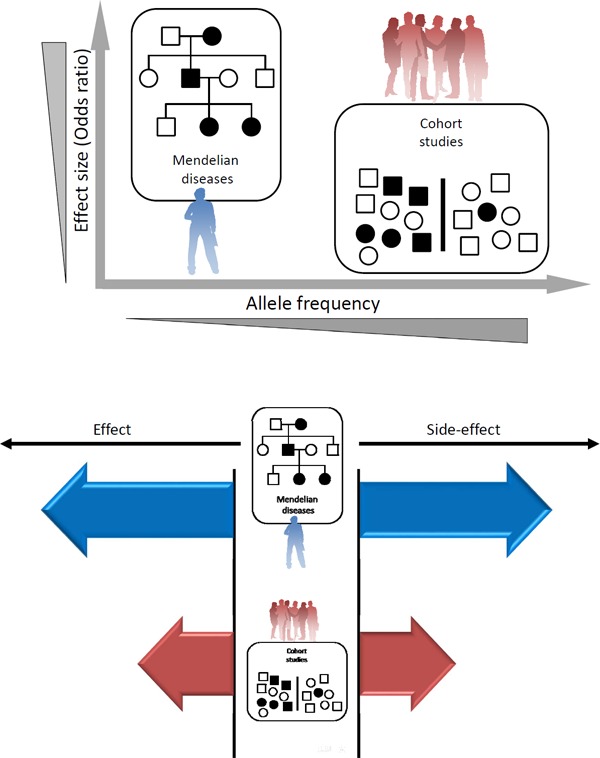
Fig. 1.

Scheme of human genetic variations and diseases
Upper panel. X-axis represents allele frequency. Y-axis represents effect sizes.
Lower panel. Consistent directions between rare as well as common genetic variations definitely ascertain the truth of nature.
