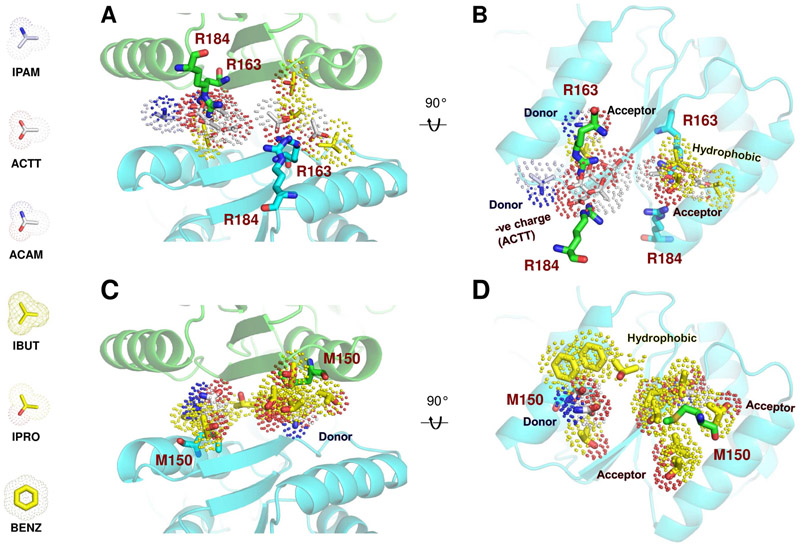
Figure 6. Pharmacophore models for two high-affinity pockets at the GluA3 NTD LL interface.
(A-B) Binding pocket formed by R163 and R184 from adjacent subunits and corresponding pharmacophore model shown from the bottom (A) and an open interface view (B). The probes represent the consensus types and poses sampled during the simulations. Hydrophobic probes are colored yellow and polar probes white, hydrogen bond donors are blue and acceptors red. Note the abundance of acetates, making it a primarily negatively charged site. (C-D) The hotspot around M150 and its pharmacophore model, colored as above. This site is hydrophobic (yellow).

