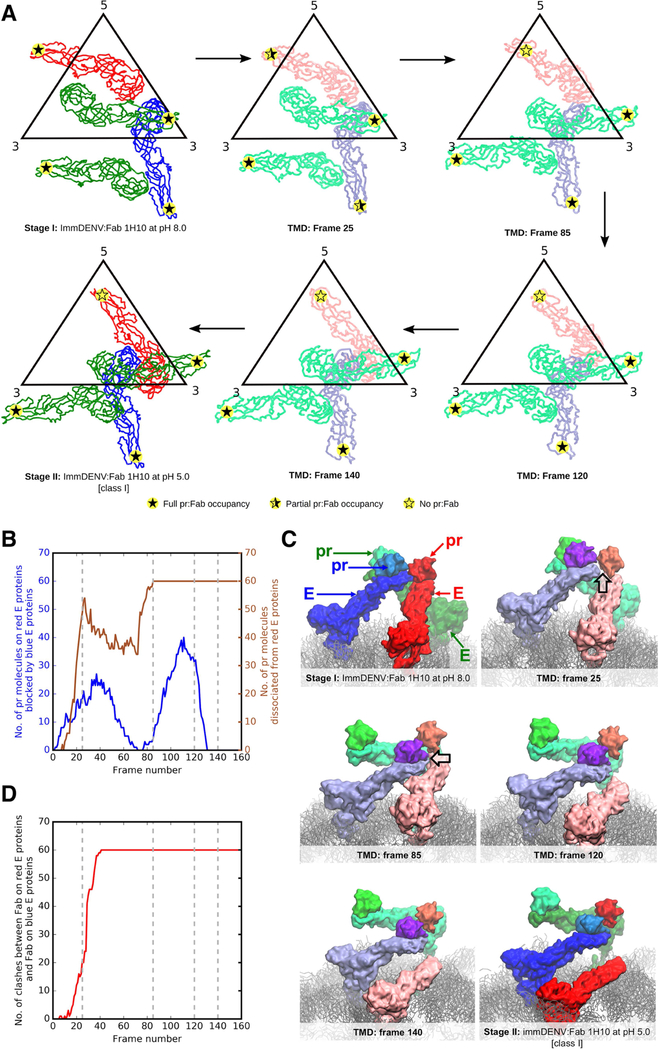
Figure 6. Molecular insights into the stage I-II transition using molecular dynamics simulations.
(A) Representative snapshots extracted from targeted molecular dynamics simulations and their corresponding simulation frame number. E proteins from molecular simulations are colored in lighter colors than those of the Stage I and II cryoEM structures. Level of pr-Fab occupancies are shown as filled or partially filled stars.
(B) Pr molecules interacting with the red E proteins were blocked by the neighboring blue E protein molecules within a trimeric spike during the structural rearrangement from stage I to II. Plot showing number of pr molecules on the red E proteins that are blocked by neighboring blue E protein molecules during the structural arrangement (blue line) against frame number. The number of dissociated pr proteins from the E proteins (right y-axis) is also shown in brown. The grey dashed lines indicate the frames of the snapshots in panel (A).
(C) Snapshots of the motions of pr:E complexes within a trimeric spike at different frames, showing clashes (black outlined arrow in frames 25 and 85) mainly occurring between the pr:blue E protein complex, with the pr molecule on the red E protein leading to the dissociation of the pr from the red E protein molecule. The E proteins from the molecular simulations are colored in lighter shades than those from Stage I and II cryoEM structures.
(D) Plot of number of Fab-Fab clashes between the Fab on the pr-blue E protein and that on the pr-red E protein (red line) throughout the simulation. At around frame 25, severe clashes between the Fab:pr:E red molecules and Fab:pr:E blue molecules were observed when Fabs were superimposed onto the simulated pr-E virus molecule.
See also Figures S5, S6, S7 and S8.

