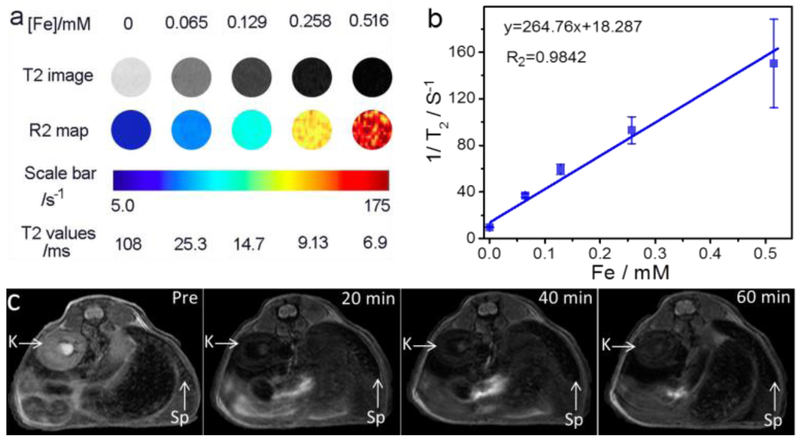
Fig. 4.
MRI of BFNPs. (a) T2-weighted MR images and R2 maps of MRI phantoms for BFNPs at different iron concentrations, (b) Plots of l/T2 as a function of iron concentration. The slope of the curve in (b) is defined as the transverse relaxivity, r2. (c) In vivo T2-weighted MR images of the cross-sections of mice receiving BFNPs treatment with dynamic time-resolved MRI acquired at various time points after intravenous administration. The arrows denote various organs: kidney (K) and spleen (Sp).

