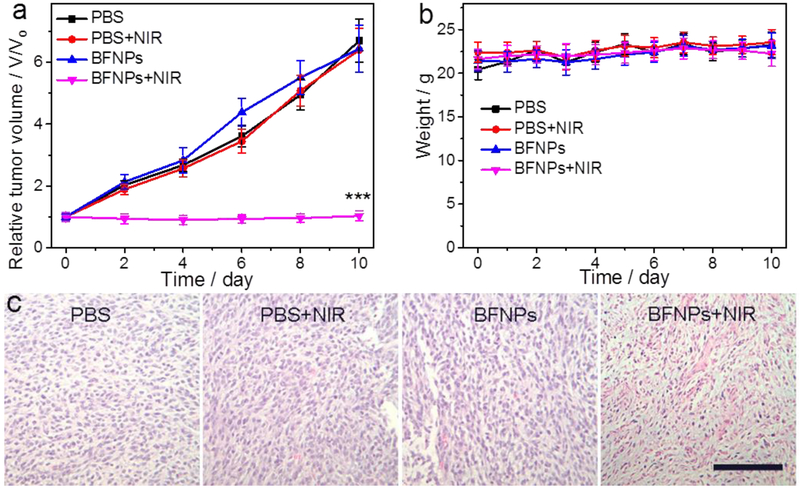
Fig. 6.
In vivo PTT using BFNPs. (a) Tumor growth curves of mice treated under different conditions (four mice per treatment group). (b) Weight of mice from different groups over a 10-day period, (c) H & E-stained tumor sections collected from mice after treatments (scale bar =125 μm). Statistical analysis was performed using the Student’s two-tailed T-test (***P< 0.001).

