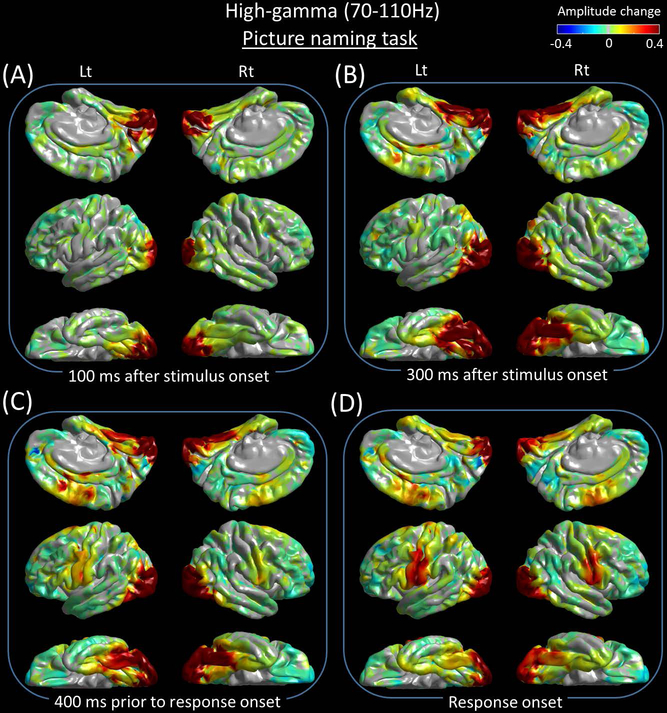
Figure 3. Snapshots of picture naming-related high-gamma activity.
Event-related amplitude augmentation is reflected by red, whereas suppression by blue. ‘+0.4’ indicates that the amplitude was augmented by 40% compared to the mean during the resting period between −600 and −200 ms relative to stimulus onset. (A) 100 ms after stimulus onset. (B) 300 ms after stimulus onset. (C) 400 ms prior to response onset. (D) Response onset.

