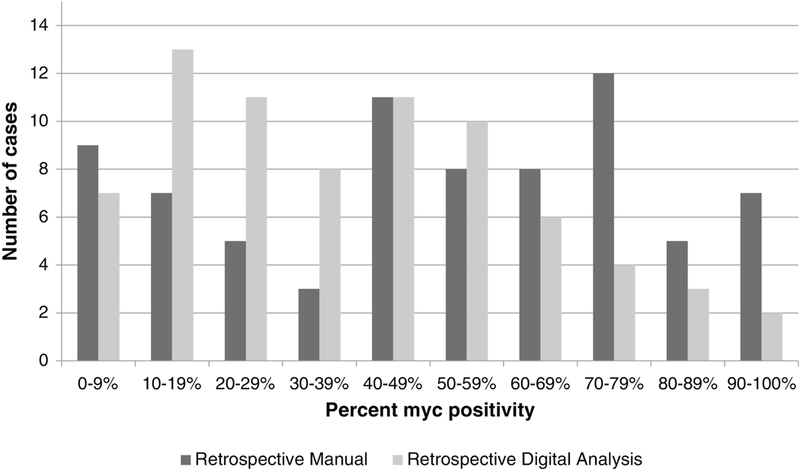
Figure 3:

Distribution of percent MYC positivity by retrospective manual review (pathologist #1) and retrospective digital image analysis. Represented in this figure are the percentages using any nuclear staining (retrospective manual) and 1+ to 3+ nuclear positivity (retrospective digital analysis). Both the manual and digital analysis methods show wide variability in percent MYC positivity, including many cases surrounding the suggested cut-off of 40%. The manual method showed a bias toward higher estimation of MYC percent positivity, while the digital analysis method showed a bias toward lower estimation of MYC percent positivity.
