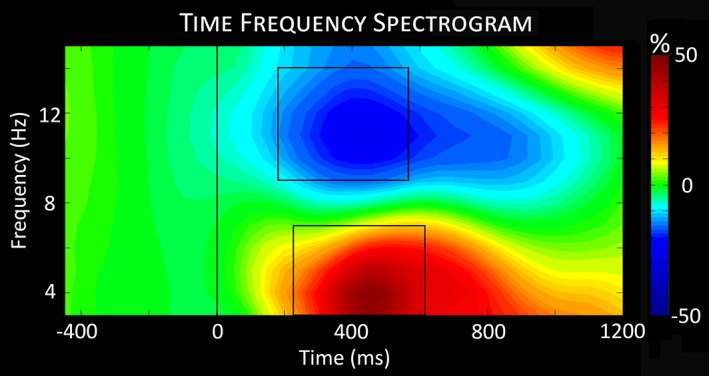
Figure 2.

Time–frequency spectrogram. The time–frequency analyses revealed significant oscillatory activity in theta and alpha frequency bands across both conditions (congruent and incongruent) and all participants. The significant windows (p < .001, corrected) were 9–14 Hz from 200 to 600 ms (alpha) and 3–7 Hz from 250 to 650 ms (theta) [Color figure can be viewed at http://wileyonlinelibrary.com]
