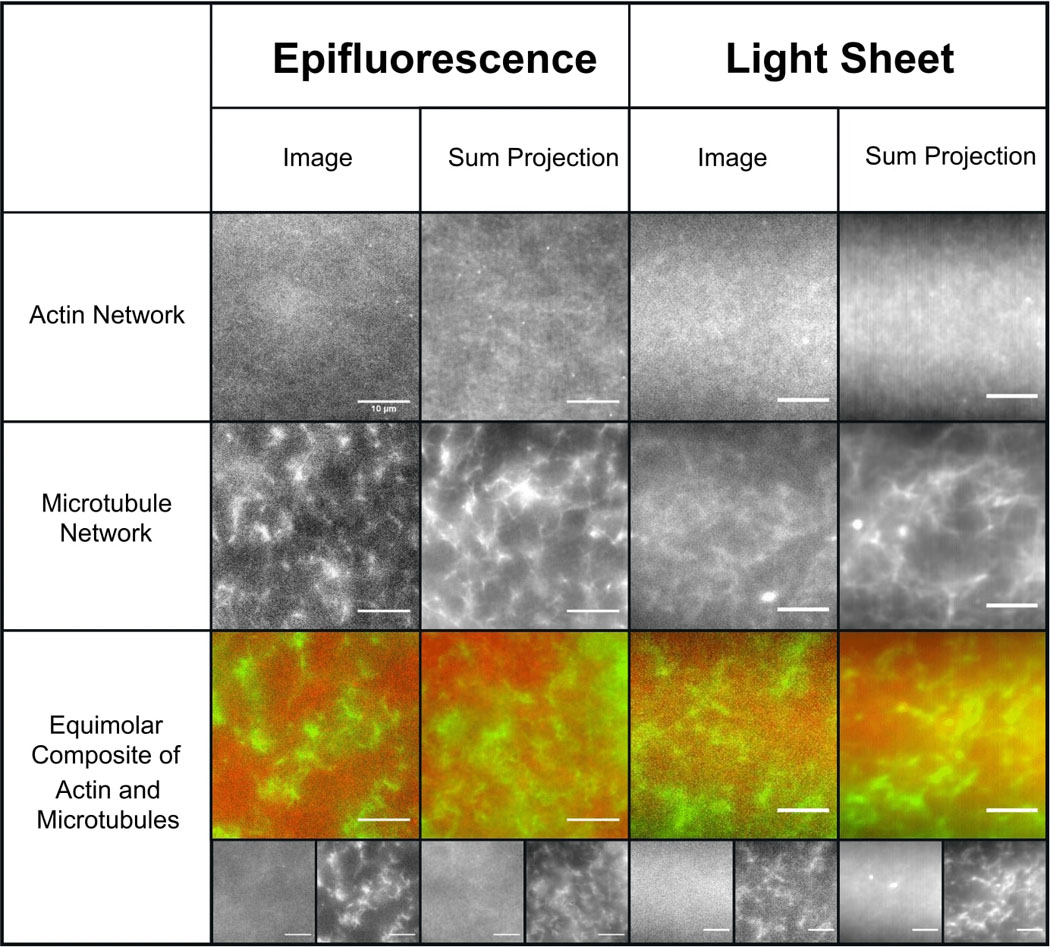
Figure 2. In vitro cytoskeleton networks exhibit robust characteristics and structure.

Representative images (left) and sum projections of videos (right) taken using the epifluorescence and light-sheet microscopy methods used for SMCT and SPIDDM measurements. All scale bars represent 10 μm. As shown, networks formed in the respective sample chambers are nearly indistinguishable from one another. Actin networks have a smaller mesh size than microtubule networks, exhibited as more uniformity at the microscale. Microtubules form more rigid structures, exhibited as higher contrast projections compared to actin. In composites, actin and microtubules are well-mixed and sterically interacting with no large-scale phase separation. In all images, actin and tubulin are labeled with Alexa-488 (1:5 ratio labeled:unlabeled monomers) and rhodamine (1:35 labeled:unlabeled dimer ratio).Videos are all 400 frames acquired at 40 fps. Though images shown have labeled filaments, experiments are carried out with unlabeled protein only.
