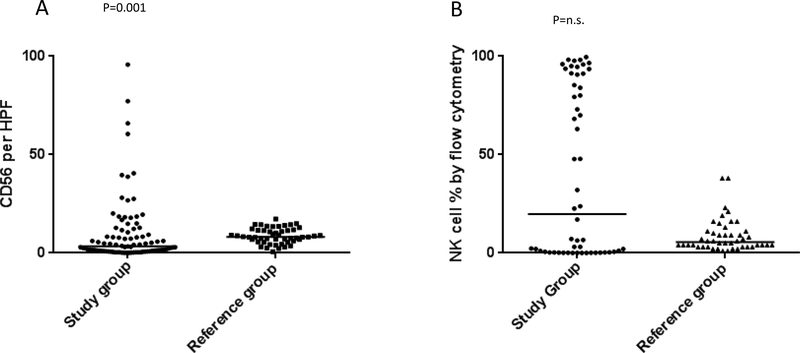
Figure 1:
Results of CD56/HPF quantitation (1A) and flow cytometric evaluation of percentage of NK cells in the lymphocyte population (1B) in the study group. (A) Scatter plot showing cumulative results of average number of CD56 positive cells per microscopic High Power Field (CD56/HPF) in the study group (filled circles, left side of the graph) as compared to AML post-induction chemotherapy reference cohort (filled squares, right side of the graph). The horizontal bars represent Medians (P=0.001 Mann Whitney test, Median 3.4 and 8.2 in the study group and reference group, respectively). (B) Scatter plot showing flow cytometry results obtained on bone marrow aspirate shown here as percentage NK cells per lymphocyte population in the study group (filled circles, left side of the graph) as compared to AML post-induction chemotherapy reference cohort (filled triangles, right side of the graph). The horizontal bars represent Medians (non-significant, Mann Whitney test, Median 19.8 and 5.5 in the study group and reference group, respectively).

