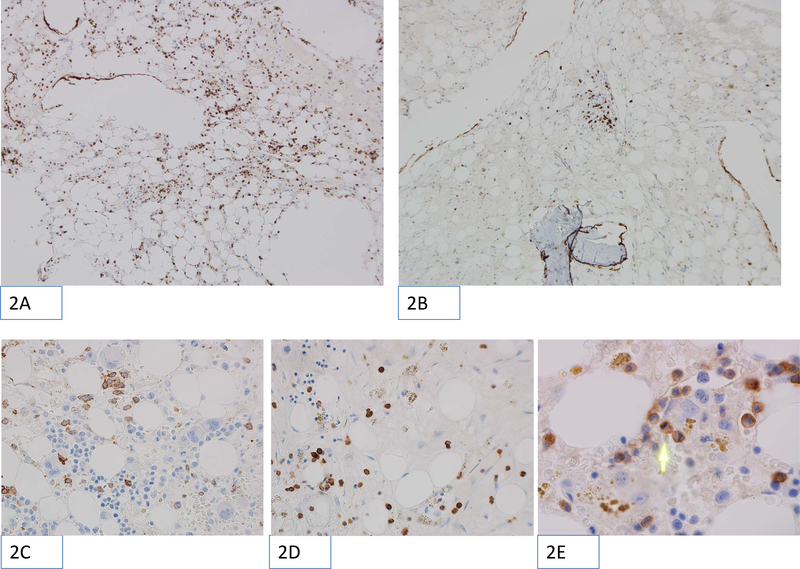
Figure 2:
Microscopic images showing examples of CD56 immunohistochemical staining performed on trephine core biopsy sections. The positively stained cells appear as brown (chromogenic stain). The images were obtained using Olympus BX46 microscope with ocular, field 22 and magnification 10×10 (panels 2A and 2B), 10×40 (panels 2C and 2D) or 10×100 with oil immersion (panel 2E). The low-power magnification images (100×) show CD56 positive NK cells distributed evenly (2A) or in focal clusters (2B). High-resolution images (400×) show examples of CD56 positive cells found in foci of active hematopoiesis (2C) or in hypocellular areas (2D). Of note, the 400× magnification corresponds to one High Power Field (HPF) in this study. Panel 2E shows very high magnification (1000× with oil immersion), with green arrow pointing to recently divided CD56 positive cell with two daughter cells visible.

