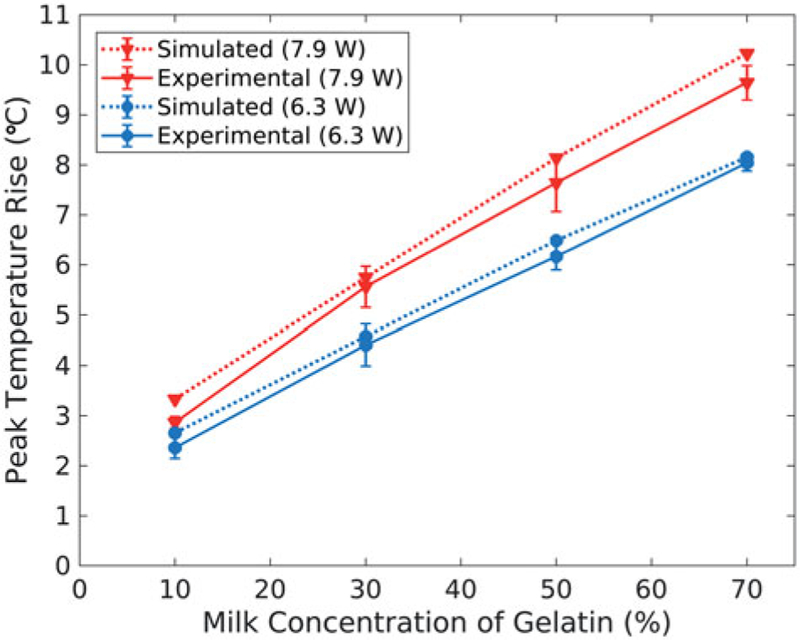
Figure 2.
Average peak temperature rise achieved in the simulated (dashed, n 1) and experimental (solid, n = 3) temperature profiles, with experimental error bars representing one standard deviation. Results are plotted as a function of milk concentration of the gelatin phantoms for both FUS sonication powers: 6.3 W (blue, circles) and 7.9 W (red, triangles).

