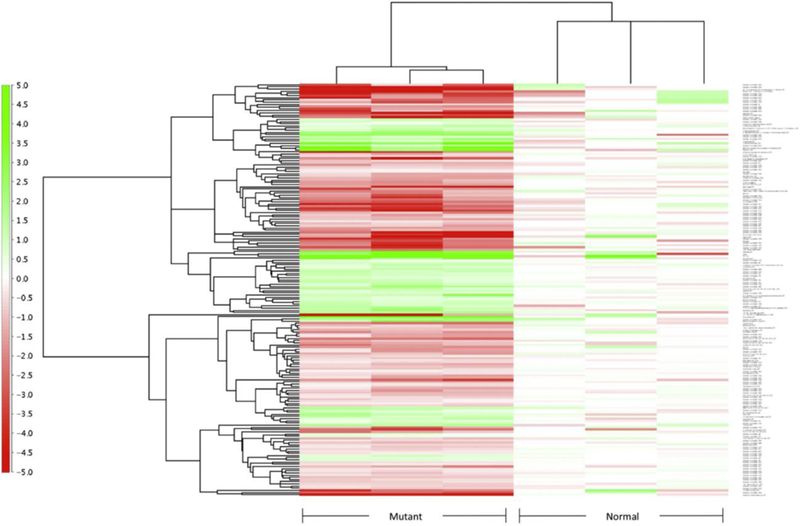
Figure S1. Heatmap analysis of dysregulated metabolites in the mouse liver.

Mutant stands for SD mice (n=3), normal stands for heterozygous mice (n=3). Fold change is illustrated on the left.

Mutant stands for SD mice (n=3), normal stands for heterozygous mice (n=3). Fold change is illustrated on the left.