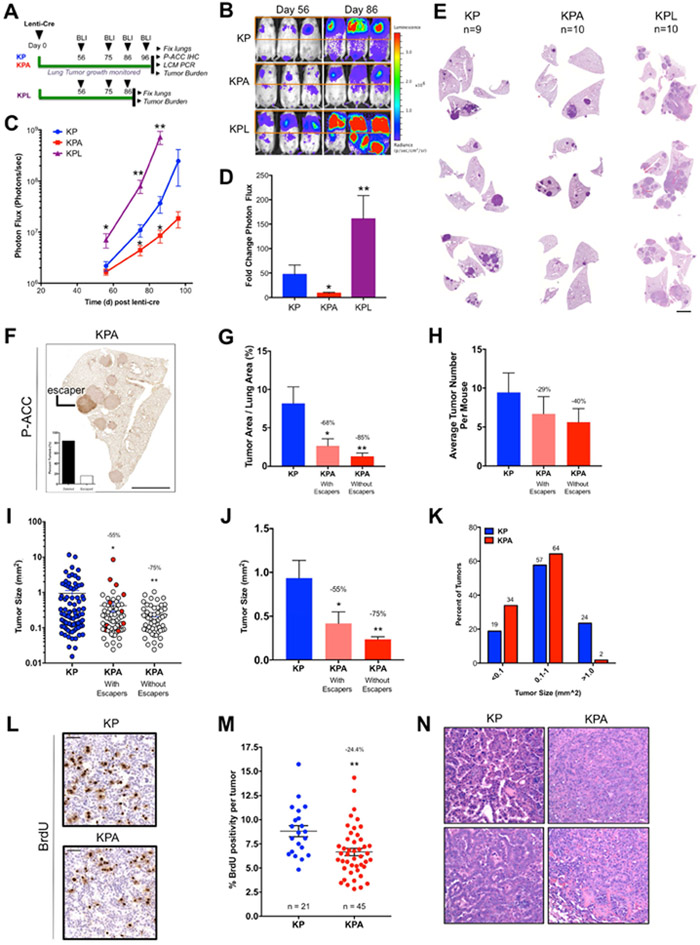
Figure 2. AMPK deletion is detrimental to the growth of KrasG12D p53−/− (KP) NSCLC.
(A) Schematic of experimental design in KP, KP-AMPK floxed (KPA) and KP-LKB1 floxed (KPL) mouse models.
(B) Representative BLI images. Scale bar represents photons/sec/cm2/sr.
(C) Average longitudinal BLI data.
(D) Fold change in BLI during the imaging period (Day 56 to Day 96).
(E) Representative H&E stained sections at endpoint. Scale bar, 2000μm.
(F) Representative image of P-ACC IHC in KPA tumors. Inset: quantitation of escapers across entire cohort. Scale bar, 2000μm.
(G-K) Post hoc analyses from H&E sections. KPA tumors that escaped AMPK deletion were determined by P-ACC IHC analysis of sections serial to H&E sections and are included or excluded as indicated.
(G) Tumor area as a percentage of total lung area per mouse.
(H) Average tumor number per mouse.
(I-J) Individual tumor size. (I) Each dot represents a single tumor. KPA tumors that escaped AMPK deletion are indicated in red. (J) Average tumor size. (K) Tumors from (I) binned by size.
(L-M) BrdU IHC. (L) Representative BrdU IHC images. (M) Percent BrdU positivity normalized to tumor cell number excluding KPA tumors that escaped AMPK deletion. Scale bar, 50μm.
(N) Representative histopathology images.
Data are represented as mean ± SEM. * P<0.05 ** P<0.01 *** P<0.001 relative to KP determined by students t test.

