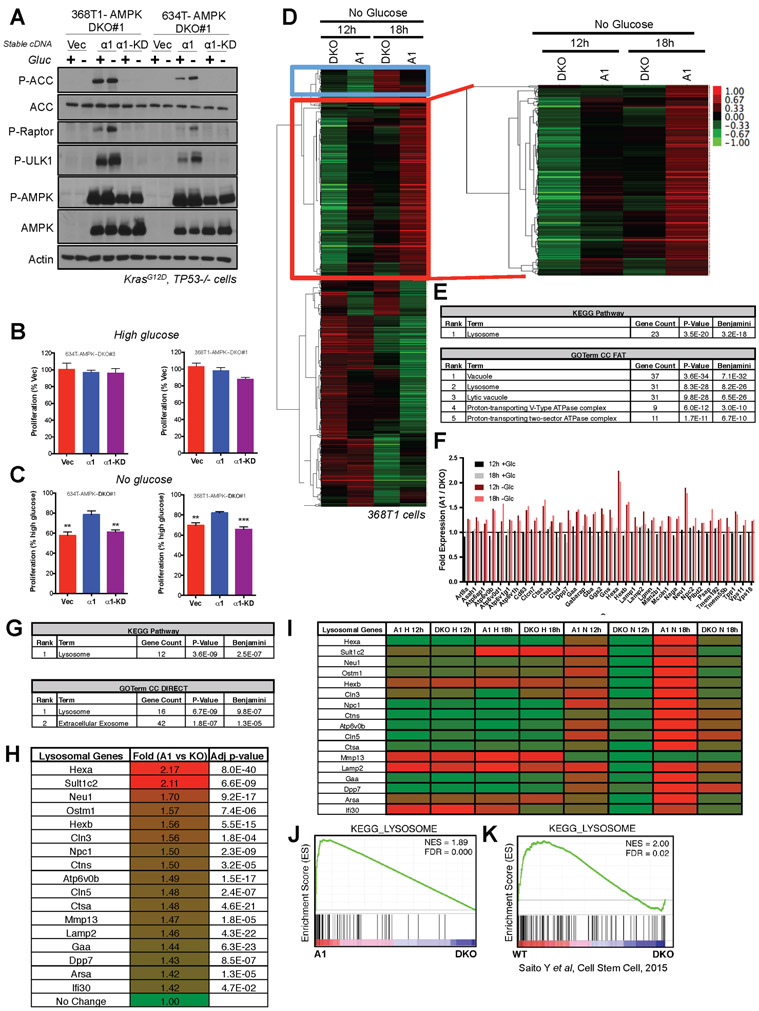
Figure 3. AMPK promotes lysosomal gene expression upon glucose starvation in NSCLC cells.
(A) Western blots for AMPK signaling in lysates from 368T1 and 634T mouse NSCLC cell lines deleted for AMPK by CRISPR/Cas9 and reconstituted stably with vector control (Vec), AMPKα1 (α1) or kinase-dead AMPKα1 (α1-KD) in the presence (+) or absence (−) of glucose (Gluc) for 18hrs.
(B) Proliferation rates of 634T and 368T1 isogenic cell lines in high glucose after 48hrs. Data are represented as percent proliferation of Vector.
(C) Proliferation rates of 634T and 368T1 isogenic cell lines in no glucose after 48hrs. Data are represented as percent proliferation of cells in high glucose.
(D-J) RNA-seq analysis of AMPKα1α2 KO 368T1 cells with vector control (DKO) or AMPKα1 (A1) stably reconstituted and grown in high or no glucose conditions for 12 or 18 hours.
(D) Cluster analysis of no glucose RNA-seq data. 548 genes cluster among the No Glucose samples, 210 of which (red box) are up regulated in AMPKα1 expressing cells in an AMPK-dependent manner.
(E) David Analysis of the 210 genes identified in (D). All terms with Benjamini <E−10 are shown.
(F) Fold expression from the RNA-seq data for each gene within the Lysosome KEGG Pathway and GOTerm enriched in (E).
(G) David Analysis of statistically significant (p<0.05) genes up regulated in AMPKα1 expressing cells (A1) compared to DKO after 12 hours of glucose deprivation (>0.5 fold change) across both RNA-seq replicates. All terms with Benjamini <E−5 are shown.
(H) Fold expression change from the RNA-seq data for each gene within the Lysosome KEGG Pathway and GOTerm enriched in (G).
(I) Heatmap depicting relative mRNA expression of each lysosomal gene from (H) across all RNA-seq conditions.
(J) Gene set enrichment analysis (GSEA) plot from RNA-seq data sorted by p-value, considering both replicates. The KEGG lysosome gene set is the only enriched gene set with an FDR <0.1. (NES) Normalized enrichment score; (FDR) false discovery rate.
(K) GSEA plot for the KEGG-Lysosome gene set analyzed from Saito et al 2015 transcriptional profiling data describing AMPK deletion (DKO) in leukemia-initiating cells. Data are represented as mean ± SEM. * P<0.05 ** P<0.01 *** P<0.001 relative to a1 in B and C as determined by students t test.

