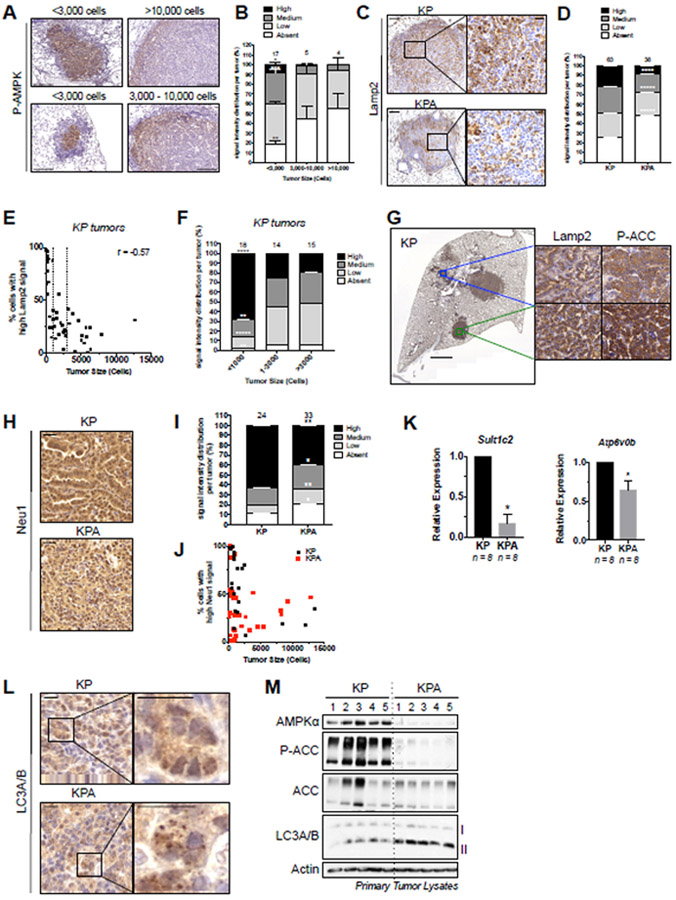
Figure 6. AMPK deletion impacts the lysosomal pathway in KP lung tumors in vivo.
(A) Representative P-AMPK IHC images in KP tumors. Tumors were binned by size and representative staining for P-AMPK is shown for each size bin. Scale bar, 100μm.
(B) Quantitation of P-AMPK IHC signal intensity binned by tumor size.
(C) Representative images from Lamp2 IHC in KP and KPA tumors. Left scale bar, 100um. Right scale bar,20um.
(D) Quantitation of Lamp2 staining intensity.
(E) Plot of tumor size (cell number per tumor) for KP tumors with High Lamp2 IHC signal intensity. Pearson correlation coefficient is shown.
(F) Lamp2 IHC signal intensity binned by tumor size (cell number per tumor).
(G) Representative images illustrating correlation between Lamp2 and P-ACC IHC signal intensity in KP tumors from serial sections. Left scale bar, 2000μm. Right scale bar, 20μm.
(H) Representative images from Neu1 IHC. (I) Quantitation of staining intensity. (J) Tumors from (I) with High signal intensity plotted according to tumor size (cell number per tumor). Scale bar, 20μm.
(K) qPCR for lysosomal gene expression in primary tumors.
(L) Representative images from LC3A/B IHC. Scale bar, 20μm.
(M) Western blots on single primary KP and KPA tumor lysates.
IHC quantitation: number of tumors analyzed indicated above each column. Data are represented as mean ± SEM. * P<0.05 ** P<0.01 *** P<0.001 determined by students t test.

