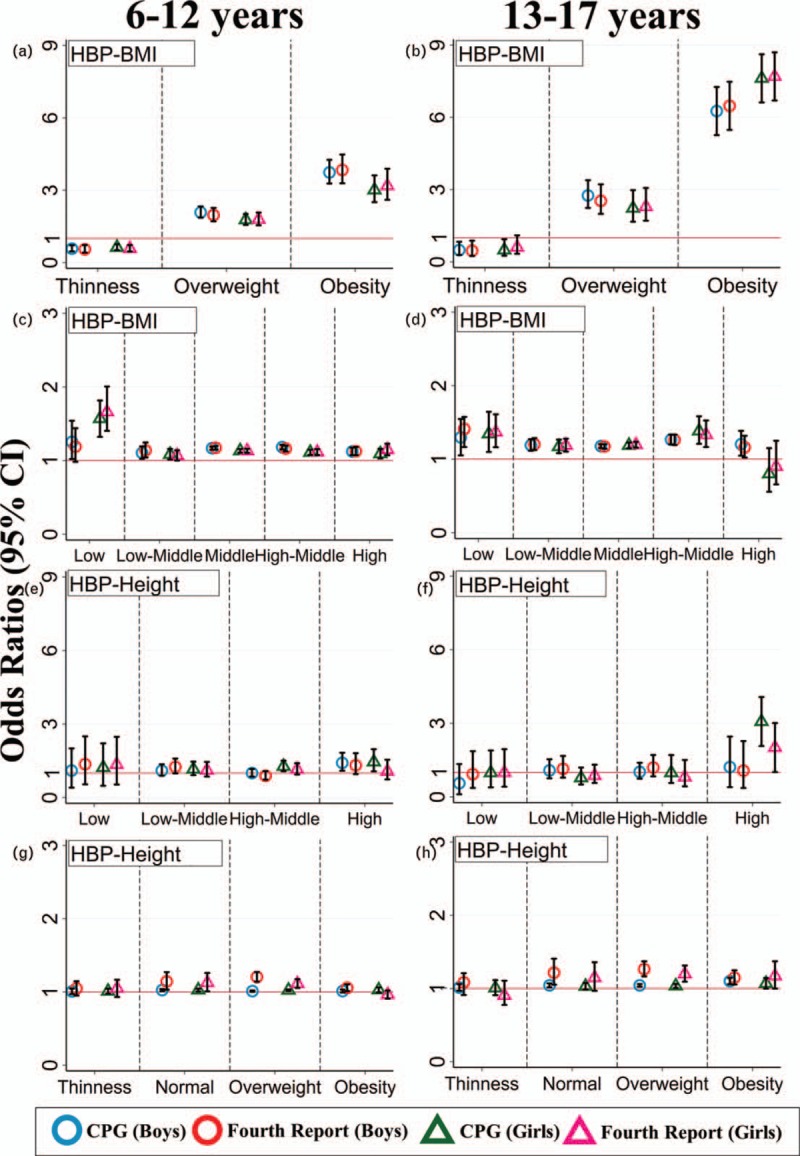
FIGURE 4.

Association between BMI, height, and high blood pressure in different BMI and height groups in both sexes of two age groups using Clinical Practice Guidelines and the Fourth Report. HBP represents high blood pressure; Red lines represents the base line (OR = 1). The ORs in BMI groups (a and b) and height groups (e and f) were calculated based on the normal weight group (categorical variables) and medium height group (categorical variables), respectively after adjusting for age, regions, rural/urban areas, height, birth weight, breastfeeding, delivery method, gestational age, family hypertension history, and household economic level. The ORs between hypertension and original values of BMI (continuous variables), as well as original values of height (continuous variables), were also calculated in different height groups and BMI groups using the two HBP definitions adjusting for the confounders mentioned above (c, d, g, and h). the dots and triangles represent the ORs in boys and girls using two HBP definitions respectively. Stitch lines represent 95% confidence intervals. HBP, high blood pressure; OR, odds ratio.
