
Figure 4. Replication fork stability correlates with carboplatin sensitivity in HGSC organoids.
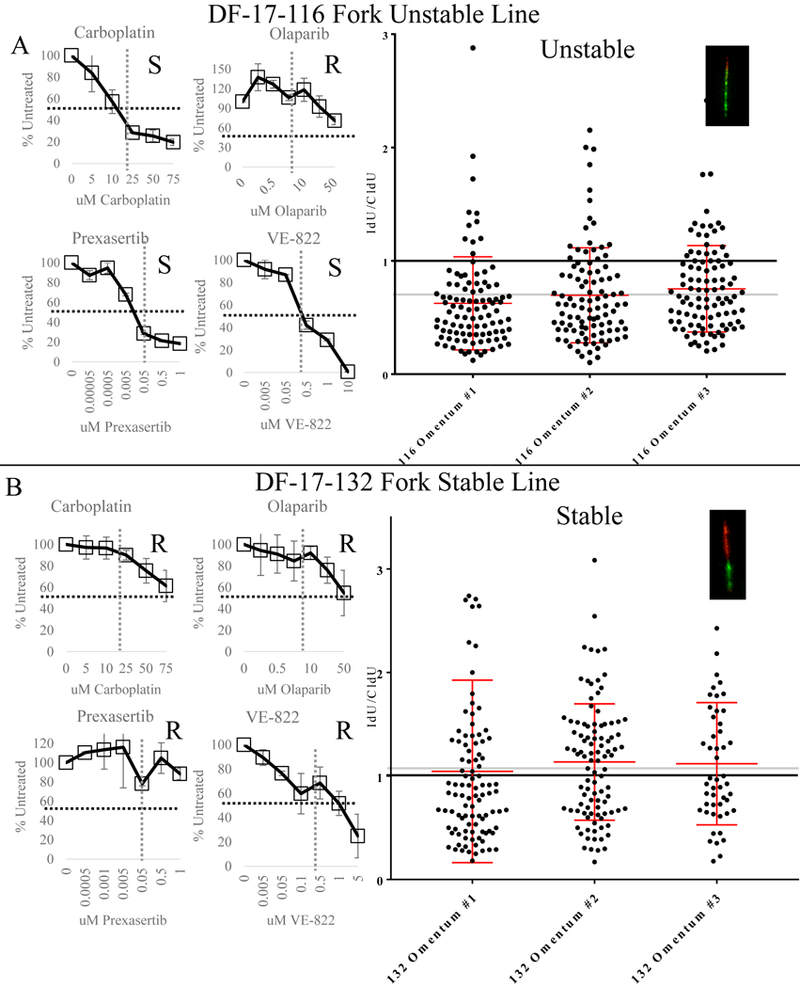
A) Sensitivity dose curves (left panel) and fiber assay results (right panel) of omental metastasis organoid cultures from a sporadic HGSC patient (DF-17–116). Dose curves for carboplatin, olaparib, prexasertib, and VE-822 show sensitivity compared to the untreated control. S stands for sensitive and R stands for resistant. A dashed black line marks 50% untreated and a dashed grey line marks the sensitivity cutoff for all organoid cultures. On the right, the ratio of IdU to CldU in three biologic replicates is shown for DF-17–116 organoids treated with hydroxyurea. A black line marks a ratio of 1, and a grey line marks the average ratio for this line. At the top of the panel is a representative fiber from this line denoting an unstable fork. B) Sensitivity dose curves (left panel) and fiber assay results (right panel) of organoid cultures from a sporadic HGSC patient post-neoadjuvant chemotherapy (DF-17–132). Dose curves for carboplatin, olaparib, prexasertib, and VE-822 show sensitivity compared to the untreated control. The graphs are designed as described in A. On the right, the ratio of IdU to CldU in three biologic replicates is shown for organoids treated with hydroxyurea. A black line marks a ratio of 1, and a grey line marks the average ratio for this line. At the top of the panel is a representative fiber from this line denoting a stable fork.