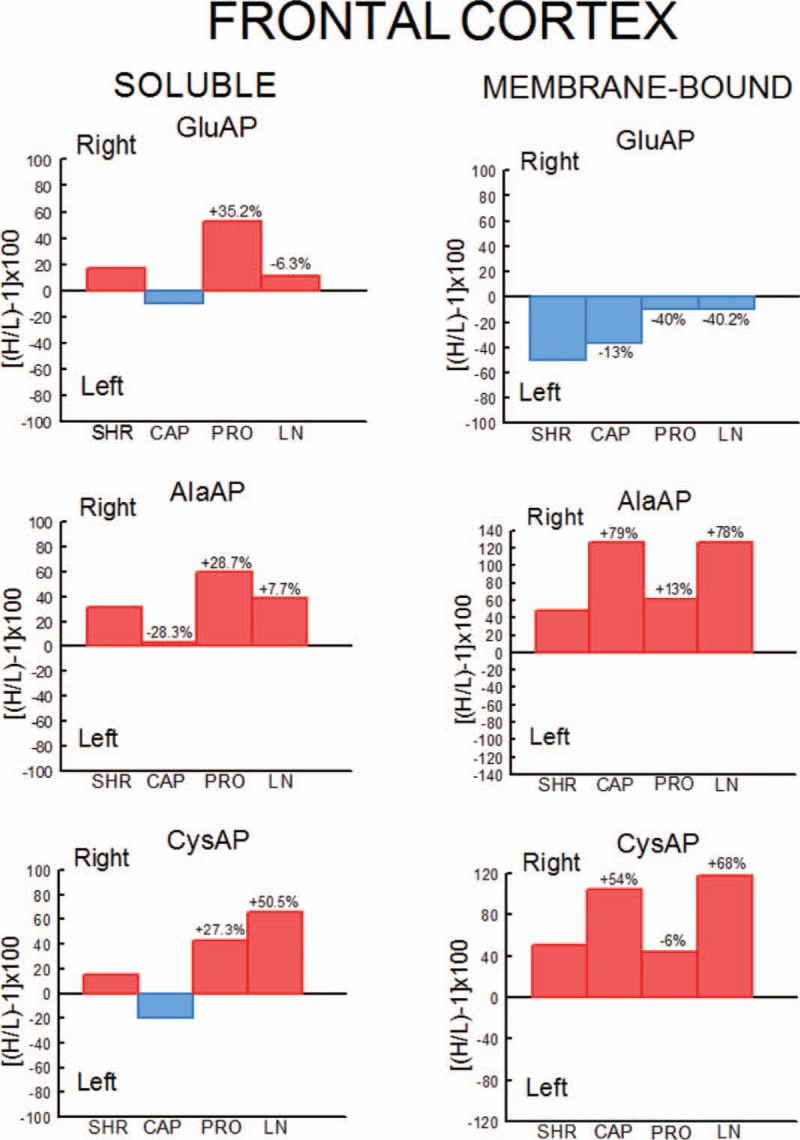
FIGURE 5.

Percentages of left or right predominance from mean values in the four groups studied. Control (SHR) and SHR rats treated with captopril (CAP), propranolol (PRO) and l-NAME (LN). Negative or positive values indicate left or right predominance, respectively. Values above the bars indicate the percentage of increase (+) or decrease (−) of left or right asymmetrical difference versus control (SHR) values. Red bars indicate right predominance; blue bars indicate left predominance. H/L, higher value/lower value.
