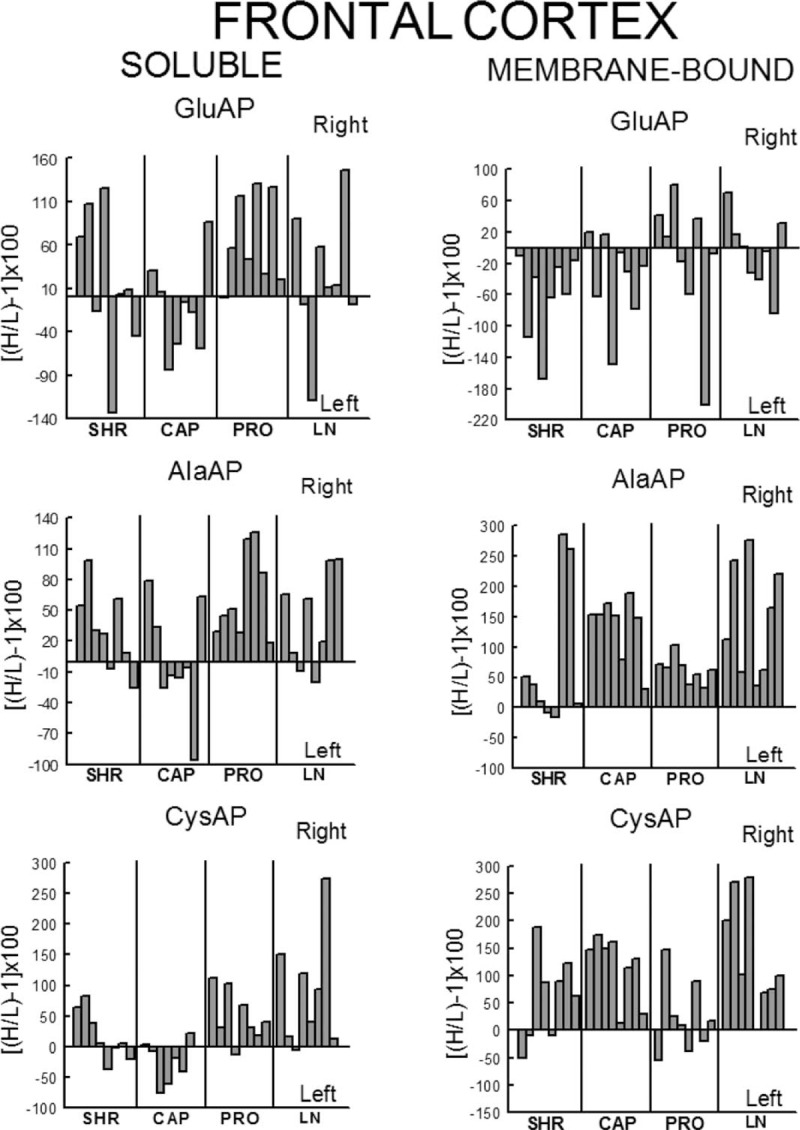
FIGURE 8.

Left or right individual percentage differences in the four groups studied. Control (SHR) and SHR treated with captopril (CAP), propranolol (PRO) and l-NAME (LN). Bars represent the percentage differences in aminopeptidase activity between the left and right sides of the frontal cortex for each of the eight rats studied in the four groups. Negative or positive values indicate left or right predominance, respectively. H/L, higher value/lower value.
