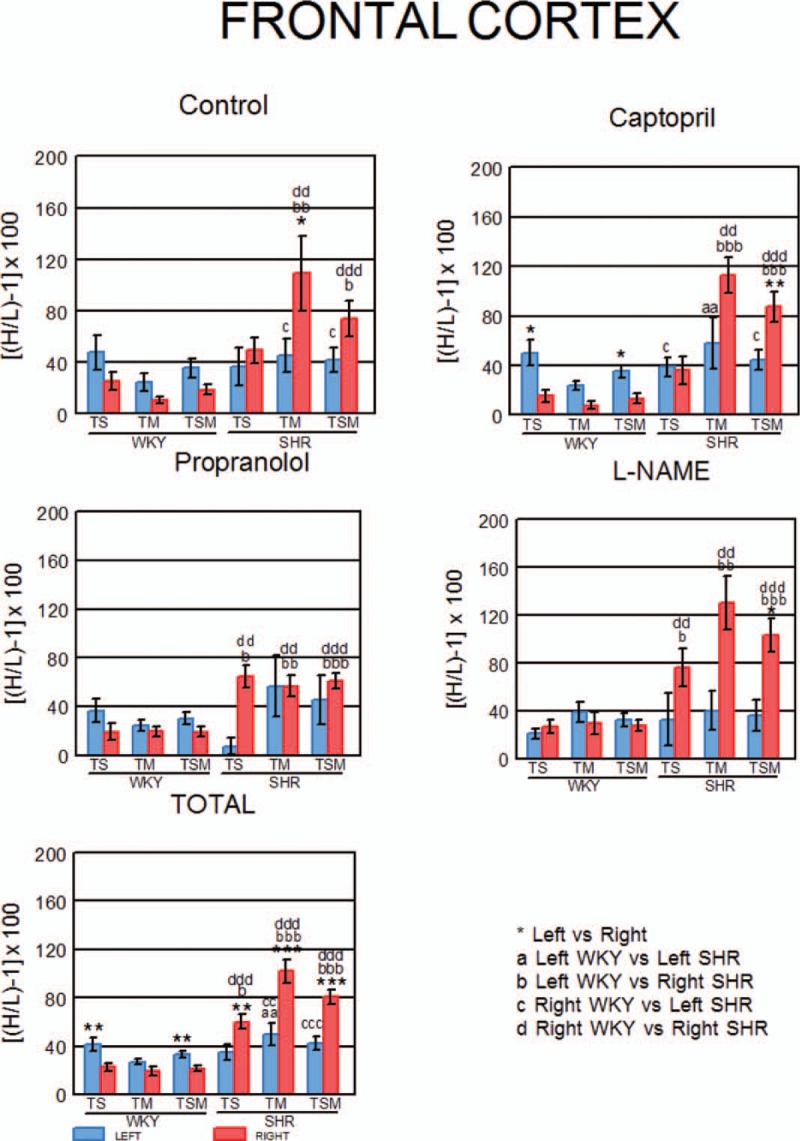
FIGURE 9.

Left or right predominance of total soluble, total membrane bound and total soluble and membrane bound activities in WKY and SHR. Mean ± SEM levels obtained with the individual values of left or right predominance of the total soluble (TS), the total membrane-bound (TM) and the total soluble and membrane-bound (TSM) activities analysed in each group and in all groups (TOTAL) of WKY and SHR. The comparisons between the left and right sides of FC into strains (a) and between strains (a–d) are also indicated.
