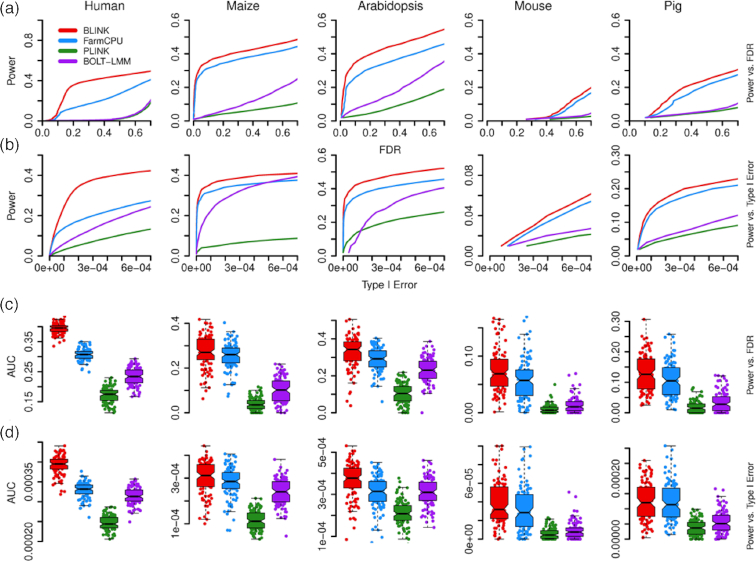
Figure 2:
Statistical power and area under the curve to detect clustered causal genes. Statistical power was defined as the proportion of simulated QTNs detected at cost, defined by either False discovery Rate (FDR) or type I error. The two types of receiver operating characteristic (ROC) curves are displayed separately for FDR (a) and type I error (b). The area under the curves (AUCs) are also displayed separately for FDR (c) and type I error (d). Four GWAS methods (BLINK, FarmCPU, PLINK, and BOLT-LMM) were compared with phenotypes simulated from real genotypes in five species (human, maize, Arabidopsis thaliana, mouse, and pig). The simulated phenotypes had a heritability of 75%, controlled by 500 QTNs for human, 100 QTNs for maize and mouse, and 50 QTNs for Arabidopsis thaliana and pig. These QTNs were randomly sampled from the available SNPs, with the restriction that every two QTNs were clustered within a distance of 300 Kb.

