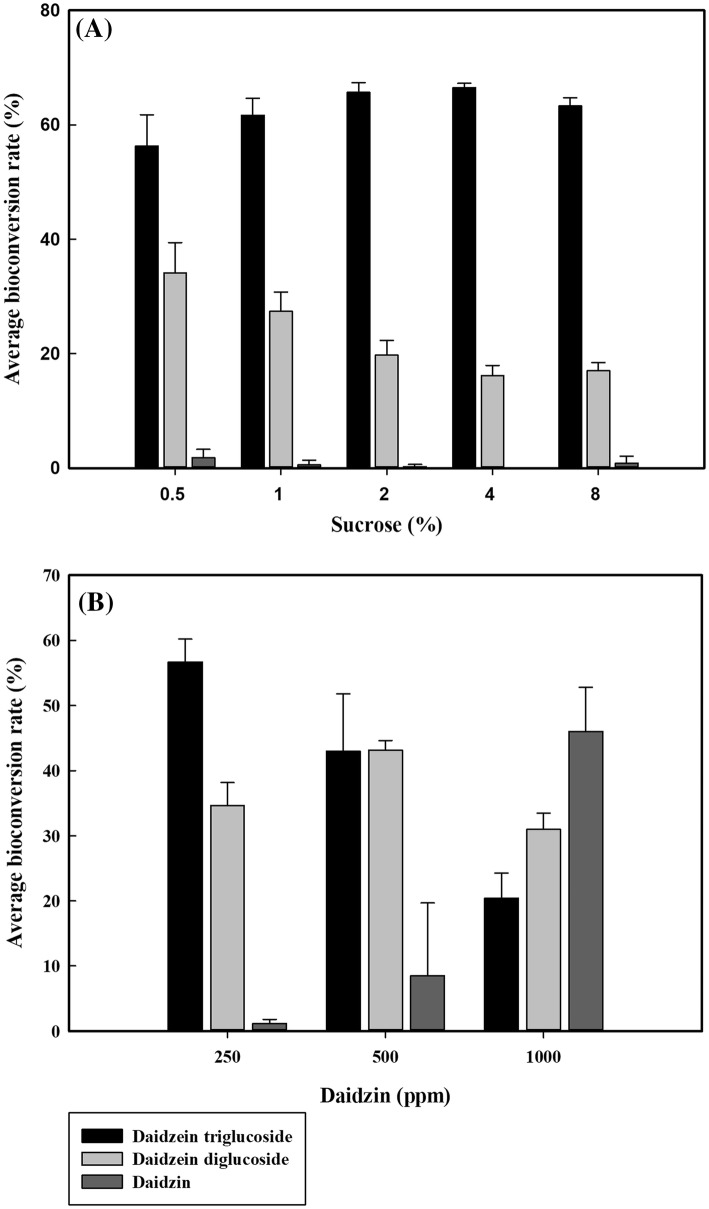
Fig. 5.
Effect of substrate concentration of sucrose (A) and daidzin (B) on the bioconversion of daidzin. Data are expressed as mean ± standard deviation (SD), n = 3. The different low-case letter superscripts in the same column indicate significant differences in different sucrose concentrations with one-way ANOVA followed by Duncan’s multiple range test (P ≤ 0.05). The different capital letter superscripts in the same column indicate significant differences in different daidzin concentrations with one-way ANOVA followed by Duncan’s multiple range test (p ≤ 0.05)

