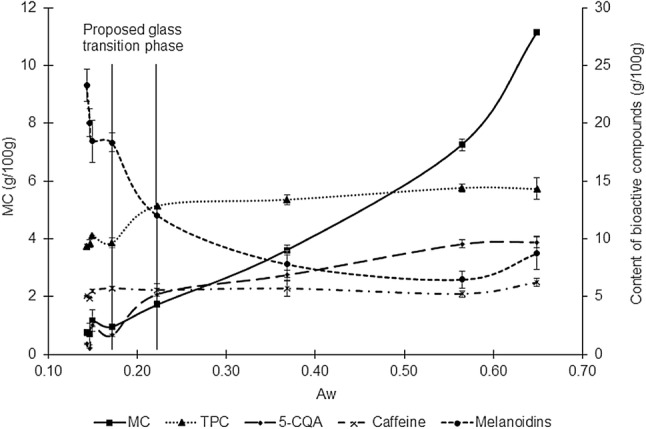
Fig. 1.

Profile of bioactive change during roasting as a function of Aw. MC Moisture content, TPC Total phenolic compounds, and 5-CQA = chlorogenic acid. Average of four data ± standard deviation

Profile of bioactive change during roasting as a function of Aw. MC Moisture content, TPC Total phenolic compounds, and 5-CQA = chlorogenic acid. Average of four data ± standard deviation