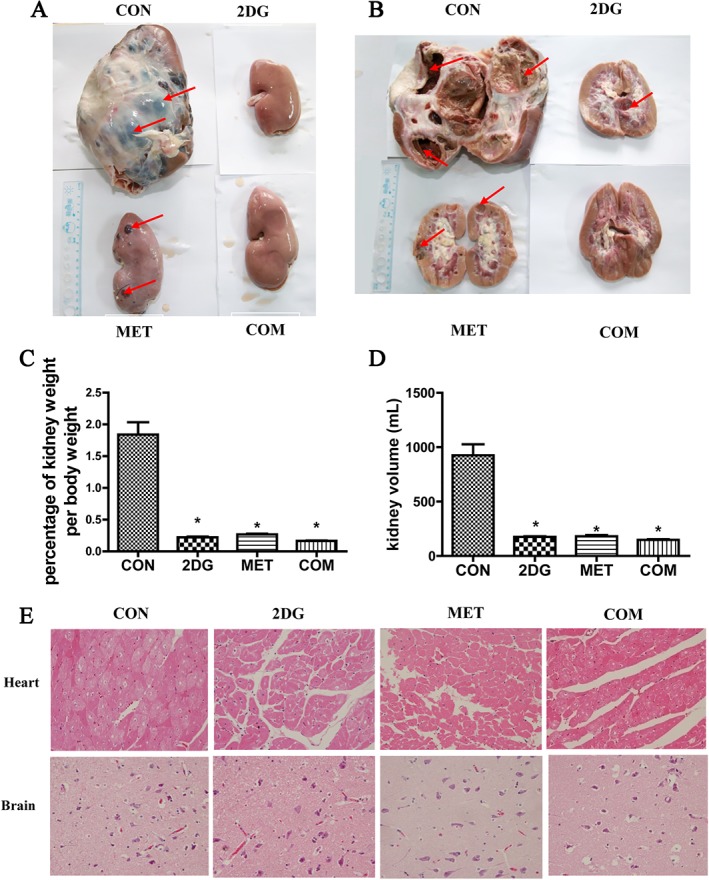
Figure 2.

Changes in kidney weight and volume between four groups after 40 months of drug treatment. (A) Altered kidney appearance in each ADPKD miniature pig group after 40 months of drug treatment. The red arrow indicates the vesicles. (B) Changes in the cross section of the kidney after drug treatment. (C) Changes in kidney weight/body weight in the different groups. (D) Changes in kidney volume in different groups. (E) HE staining of the heart and brain from the miniature pigs of each group. *P < 0.05 versus CON (control group) (n = 8).
