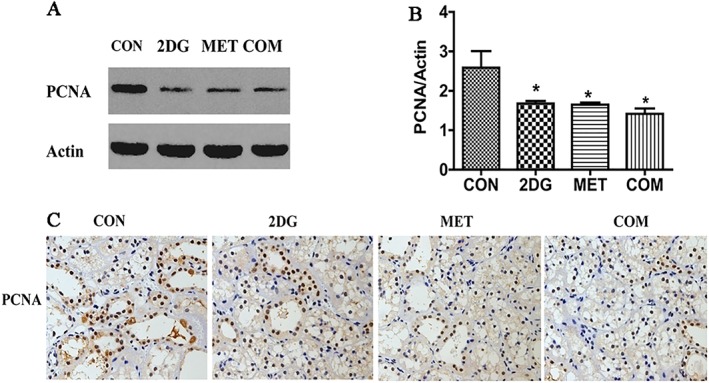
Figure 3.

Changes in the expression of PCNA in the kidneys of each of the groups examined. (A) Detection of PCNA by Western blotting. (B) Semi‐quantitative analysis of PCNA expression level. (C) Detection of PCNA by immunohistochemistry. *P < 0.05 versus CON (control group) (n = 5).
