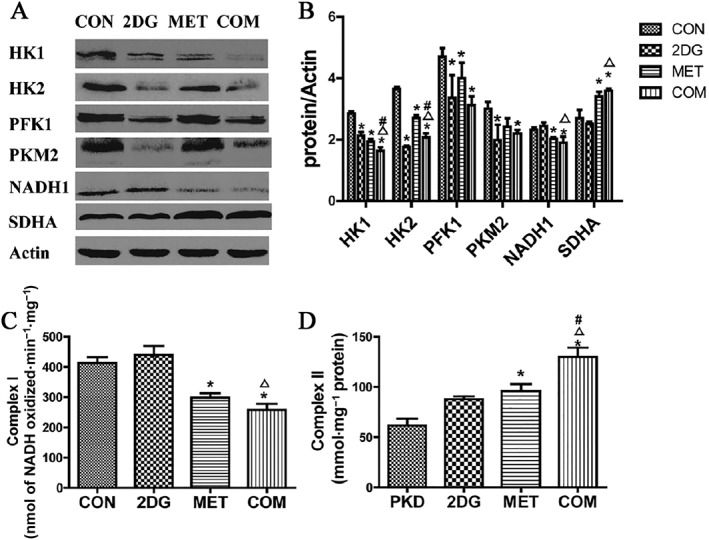
Figure 7.

Changes in the expression of key glucose metabolism enzymes and the activities of mitochondrial respiratory chain complexes in the renal tissues from PKD miniature pigs after drug treatment. (A) Detection of the expression of key glucose metabolism enzymes via Western blotting. (B) Semi‐quantitative analysis of the expression levels of key glucose metabolism enzymes. Protein expression data are presented as the mean ± SD. (C) The activity of mitochondrial respiratory chain Complex I in the renal tissues from each group of miniature pigs. (D) Activity of the Complex II of the mitochondrial respiratory chain. *P < 0.05 versus CON, △P < 0.05 versus 2DG, # P < 0.05 versus MET (n = 5).
