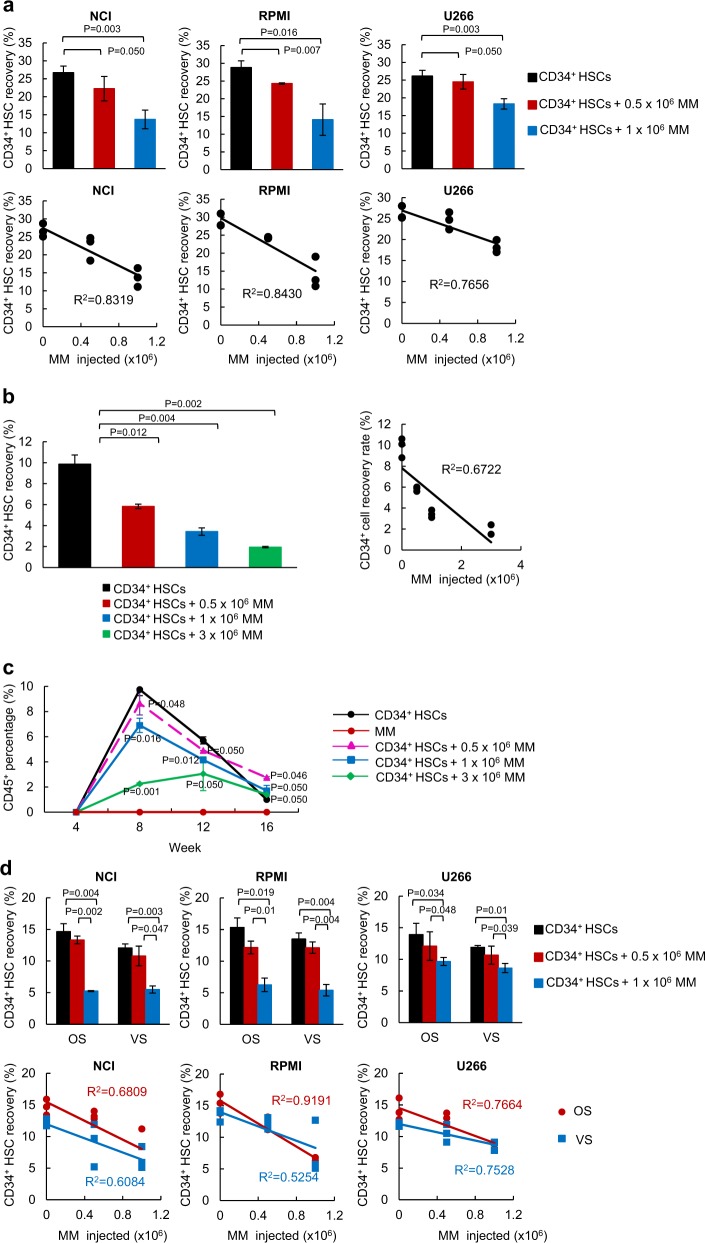
Fig. 1.
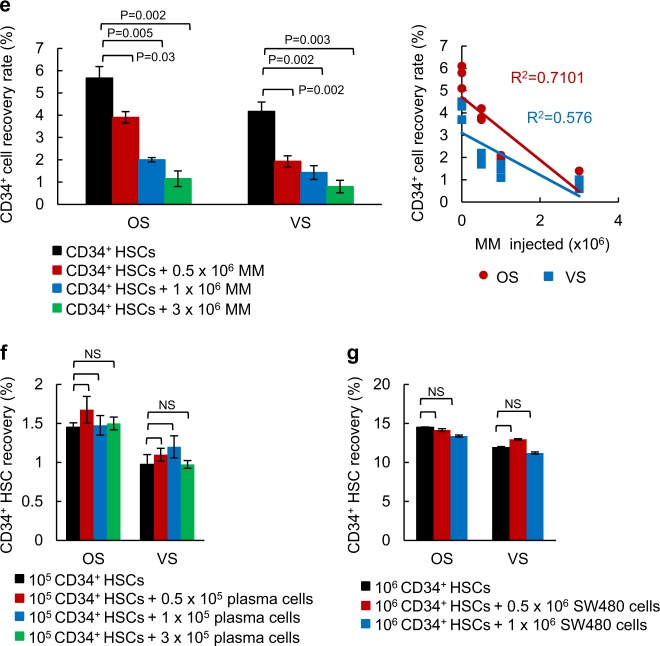
MM cells share a niche with CD34+ HSCs in the BM. a CD34+ HSCs were intravenously (i.v.) transferred into irradiated NOD/SCID mice with different numbers of MM cells (NCI, RPMI, U266, 0, 0.5 × 10⁶ or 1 × 10⁶ cells). After 60 h, the femurs were isolated and CD34+ cell recovery was calculated using FACS. The coefficient of determination (R2) values showed an inverse correlation between HSCs and MM cells. Total 72 mice were used for this experiment. Detailed mice numbers in each experimental group are described in Table S1. b CD34+ HSCs were i.v. transferred to NSG mice with different numbers of RPMI MM cells (0, 0.5 × 10⁶, 1 × 10⁶ or 3 × 10⁶ cells). After 16 weeks, the femurs were isolated and CD34+ cell recovery was calculated using FACS. The R2 values showed an inverse correlation between the engrafted HSCs and MM cells. Total 24 mice were used for this experiment. Detailed mice numbers in each experimental group are described in Table S2. c CD34 HSCs were i.v. transferred to NSG mice with different numbers of RPMI MM cells. Facial blood samples were taken at 4, 8, 12, and 16 weeks post transplantation, and the amount of CD45+ leukocytes was analyzed in the blood using FACS. Total 24 mice were used for this experiment. Detailed mice numbers in each experimental group are described in Table S2. d MM cells occupy both the osteoblastic (OS) and the vascular (VS) niches in the BM. CD34+ HSCs were transferred with different numbers of MM cells into NOD/SCID mice. After engraftment for 60 h, the BM was separated into the OS or the VS niche and CD34+ recovery was calculated using FACS. The R2 analyses showed an inverse correlation between MM cell numbers and HSC recovery rates. A total of 66 mice were used in this experiment. Detailed mice numbers in each experimental group are described in Table S3. e CD34+ HSCs were i.v. transferred to NSG mice with different numbers of RPMI MM cells (0, 0.5 × 10⁶, 1 × 10⁶, or 3 × 10⁶ cells). After 16 weeks, the BM was separated into the OS and the VS and CD34+ cell recovery was calculated using the FACS. The calculated R2 showed an inverse correlation between the engrafted HSCs and MM cells. The data are represented as the mean ± SD (error bars). The statistical significance was calculated using an unpaired Student’s t-test and is represented as a P-value. Total 24 mice were used in this experiment. Detailed mice numbers in each experimental group are described in Table S4. f Normal plasma cells do not compete with CD34+ HSCs for the BM niche. CD34+ HSCs were transferred with different numbers of plasma cells into NOD/SCID mice. After engraftment for 60 h, the BM were separated into the OS and the VS and CD34+ recovery was calculated using FACS. Total eight mice were used. g SW480 colon cancer cells did not compete with CD34+ HSCs for BM niche. CD34+ HSCs were transferred with different numbers of SW480 cells into NOD/SCID mice. After engraftment for 60 h, CD34+ recovery was evaluated using FACS. Total nine mice were used


