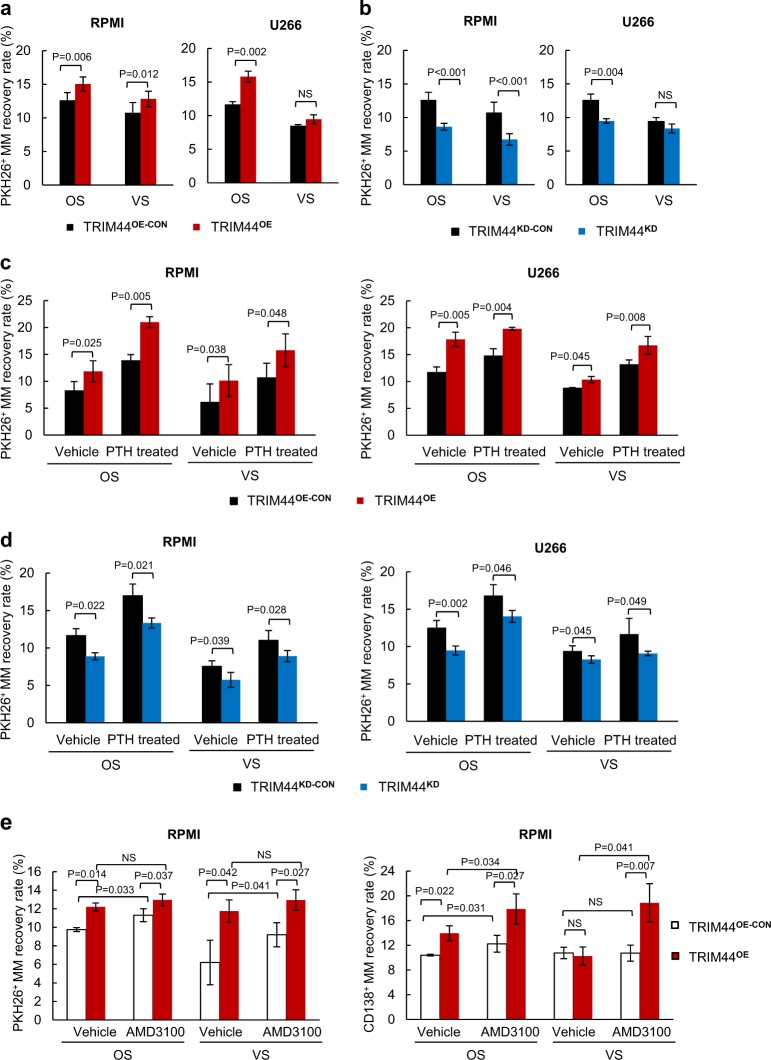
Fig. 3.
TRIM44 expression increases quiescent MM cell engraftment in the OS niche. a TRIM44OE-CON and TRIM44OE MM cells (RPMI, U266) were labeled with PKH26 and were i.v. injected into irradiated NOD/SCID mice. After 60 h, BM cells were separated into the OS or VS niches, and PKH+ MM cell numbers were calculated using FACS. Total 12 mice were used in this experiment. Detailed mice numbers in each experimental group are described in Table S7. b TRIM44KD-CON and TRIM44KD MM cells (RPMI, U266) were labeled with PKH26, and were i.v. injected into irradiated NOD/SCID mice. After 60 h, BM cells were separated into the OS or VS niches, and PKH+MM cell numbers were calculated using FACS. Total 12 mice were used in this experiment. Detailed mice numbers in each experimental group are described in Table S8. c NOD/SCID mice were i.p. injected with PTH (50 μg/kg) or vehicle for 21 days. PKH26 labeled TRIM44OE–CON and TRIM44OE MM cells (RPMI and U266) were then i.v. injected into the mice. After 60 h, BM cells were isolated as the OS and VS niche followed by FACS analyses. Total 24 mice were used in this experiment. Detailed mice numbers in each experimental group are described in Table S9. d NOD/SCID mice were i.p. injected with PTH or vehicle for 21 days. PKH26 labeled TRIM44KD-CON and TRIM44KD MM cells (RPMI and U266) were then i.v. injected into the mice. After 60 h, BM cells were isolated as the OS and VS nice followed by FACS analyses. Total 24 mice were used in this experiment. Detailed mice numbers in each experimental group are described in Table S9. e The recovery rates of PKH26+ TRIM44OE-CON or TRIM44OE MM cells in both the OS and VS niches were calculated in AMD3100 pre-treated mice. NOD/SCID mice were treated i.p. with AMD3100 for 5 days, followed by an i.v. injection with PKH26 labeled TRIM44OE-CON or TRIM44OE cells (1 × 10⁶). After engraftment for 60 h, MM cell recovery rates were calculated based on PKH+ staining using FACS. The statistical significance was calculated using an unpaired Student’s t-test and is represented as a P-value. Total 12 mice were used in this experiment. Detailed mice numbers in each experimental group are described in Table S10

