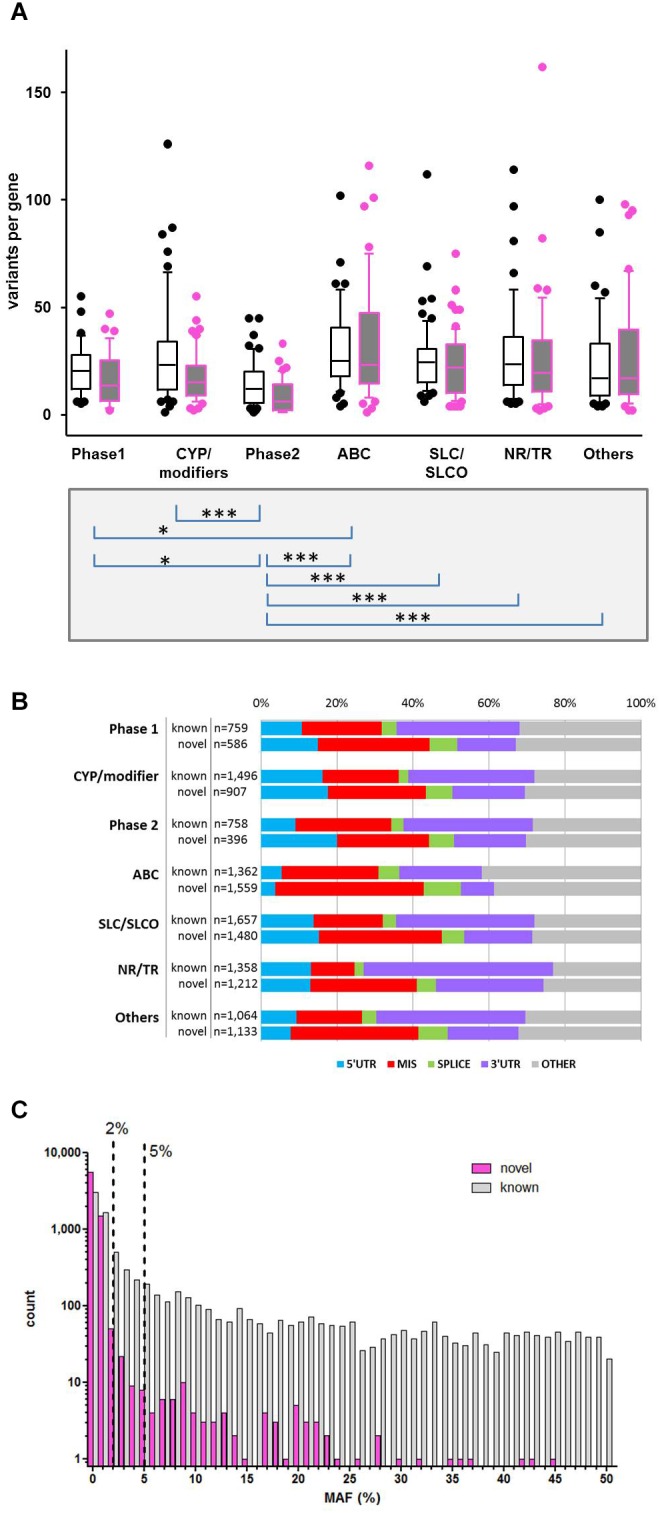
FIGURE 2.

Variability of gene families. (A) Distribution of known and novel variants in ADME gene families. The numbers of observed known and novel variants (including SNVs and INDELs) per gene are shown for the seven major functional classes of ADME genes defined in Figure 1. Open boxes, known variants; filled boxes, novel variants; boxes show median with 75th and 25th percentiles and whiskers represent 10th and 90th percentiles. Lower part: statistical significance calculated by Kruskal–Wallis with Dunn’s multiple comparison test of total number of variants per genes between family groups: ∗P ≤ 0.05, ∗∗∗P ≤ 0.001. (B) Functional categorization of variants. Total number and proportion of variants observed in each functional class is shown separately for known and novel variants. Functional classes are defined as follows: 5′UTR, upstream and 5′ untranslated region; MIS, initiator codon, missense and stop codon variants; SPLICE, variants in consensus splice site acceptor and donor regions; 3′UTR, downstream and 3′ untranslated region; OTHER, other functional classes (intronic, frameshift, synonymous, other coding and non-coding variants). (C) Comparison of minor allele frequencies (MAF) between novel and known observations. Total number of known observations with dbSNP identifier (open white bars; n = 8,454), novel observations (filled purple bars; n = 7,273); dotted line marks MAF = 2 and 5%.
