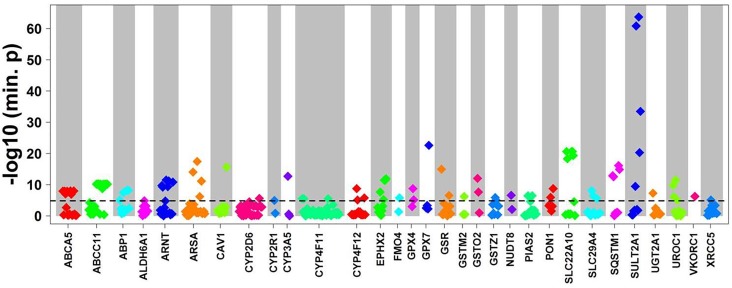
FIGURE 3.
Cis-eQTL analysis of common variants. Top cis-associations of common variants to mRNA expression. Manhattan plot presenting top results from multivariate cis association analysis between mRNA expression and common variants (MAF ≥ 2%) investigated for the corresponding gene. Displayed are minimal p-values (min. p) from four genetic models (codominant, dominant, recessive, and additive). In total, n = 3,241 common variants in n = 295 genes were analyzed. Only genes with at least one significant cis-association after Bonferroni correction (p < 0.05/3,241 = 1.54E-05; dotted line) are shown with all minimal p-values. The significant p-values are presented in Table 2.

