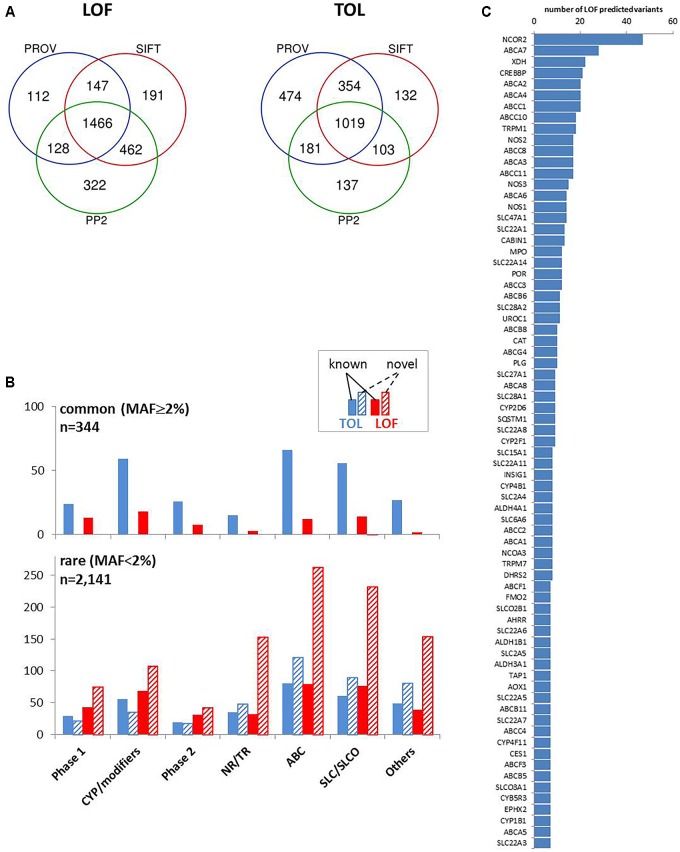
FIGURE 5.
Prediction of coding variant effects. (A) Comparison of loss-of-function (LOF) and tolerable (TOL) predictions obtained by three different prediction tools. Venn diagrams are shown for “LOF” and “TOL” predictions for n = 4,017 coding variants from Provean (“deleterious”), SIFT (“damaging”), Polyphen2 (PP2; “probably/possibly damaging”). (B) Occurrence of TOL and LOF variants in gene family groups. The distribution of the number of concordant TOL (n = 1,019; blue colored) and LOF (n = 1,466; red colored) predictions is shown for the indicated gene groups for known (filled bars) and novel (hatched bars) variants. Upper chart: variants with MAF ≥ 2%; lower chart: variants with MAF < 2%. (C) Top LOF-variant carrier genes. Shown are genes with at least seven predicted LOF-variants.

