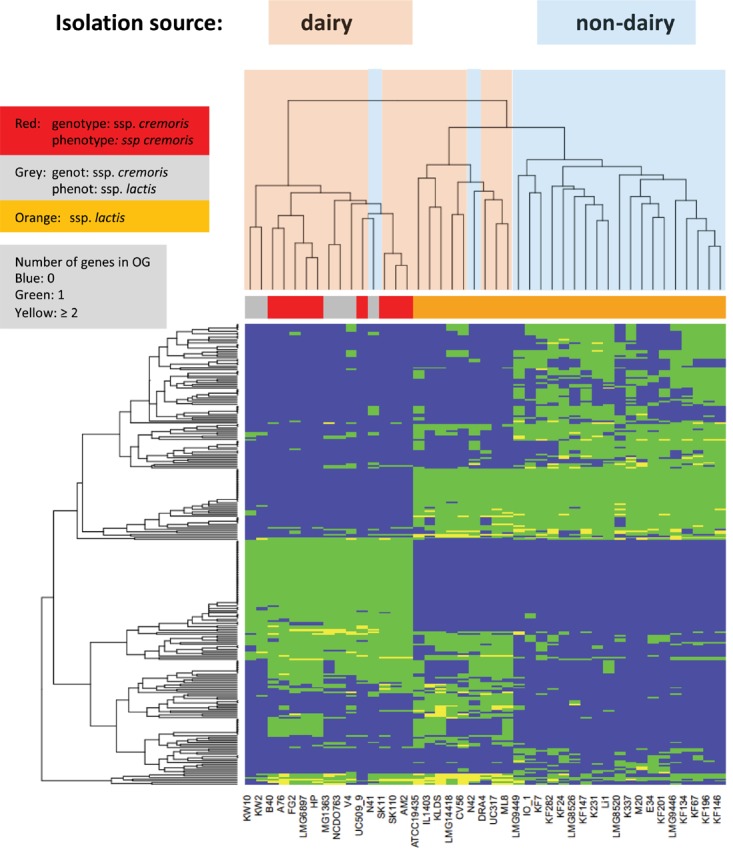
FIGURE 4.

Heatmap of orthologous groups identified as most distinguishing between the strain isolation sources. Species information is given in a color bar above the heat map. Information about dairy and non-dairy origin are given by light blue and pink coloring of the tree above the heatmap. For more details see Supplementary Table 1/Sheet 4.
