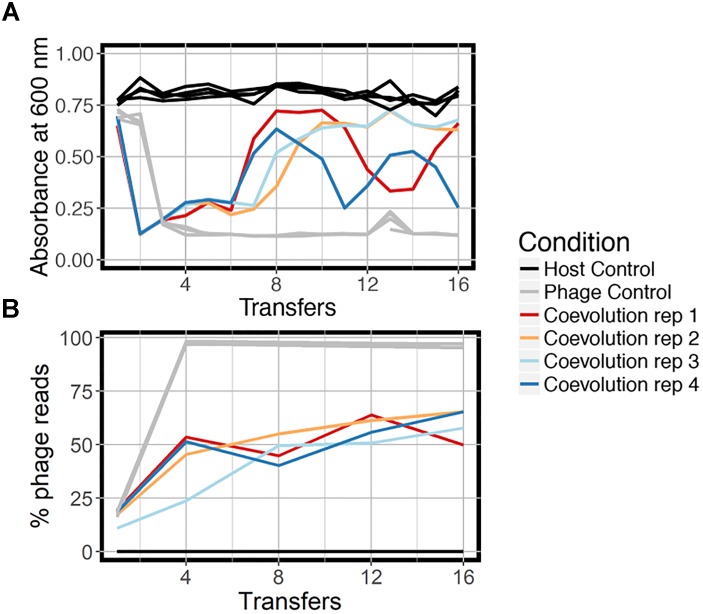
FIGURE 2.
Growth dynamics of experimental coevolution. (A) Optical density of the bacteria for each branch of the experiment, measured at the end of 12 h prior to diluting back 10-fold in fresh BHI media. All replicates of the host control and phage control are shown in the same color because there was little variation. (B) Proportion of total sequenced reads mapping to phage EfV12-phi1 indicates the relative abundance of this phage at each timepoint. Reads that did not map to phage mapped to E. faecium.

