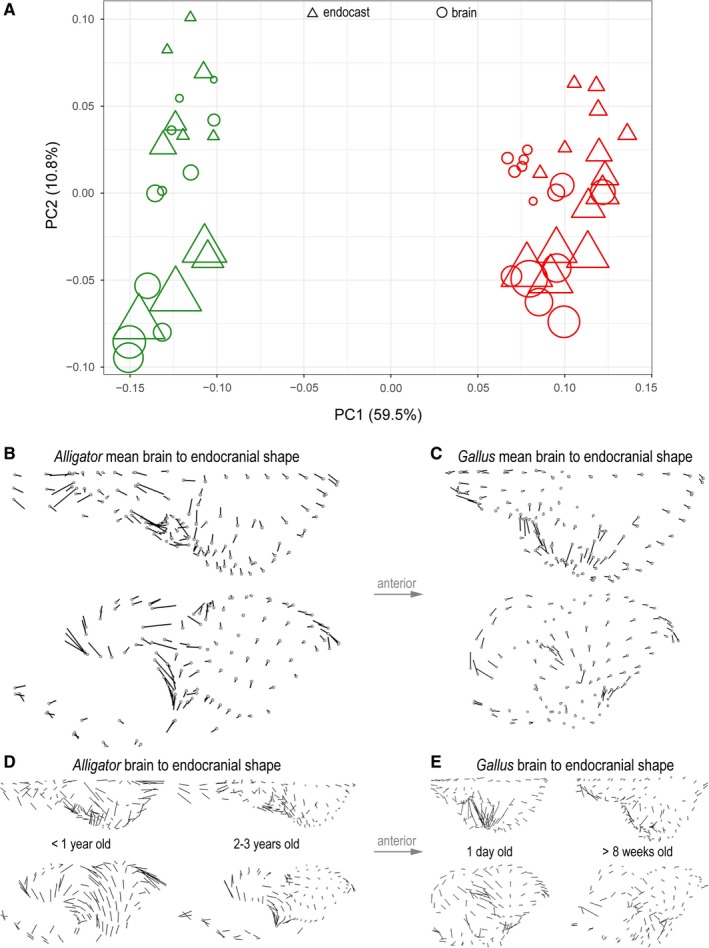
Figure 5.

Shape variation in endocranial and brain shape data of Alligator (green) and Gallus (red). (A) Morphospace constructed from PC1 and PC2 of shape. Circles and triangles denote brains and endocasts, respectively. The size of data points corresponds to non‐log‐transformed centroid size. Direction and magnitude of differences in landmark positions from mean brain to mean endocranial shape in Alligator (B) and Gallus (C). Brain‐to‐endocast shape differences in perinatal and more mature specimens in (D) Alligator and (E) Gallus. The magnitude of vectors reflects true shape distance.
