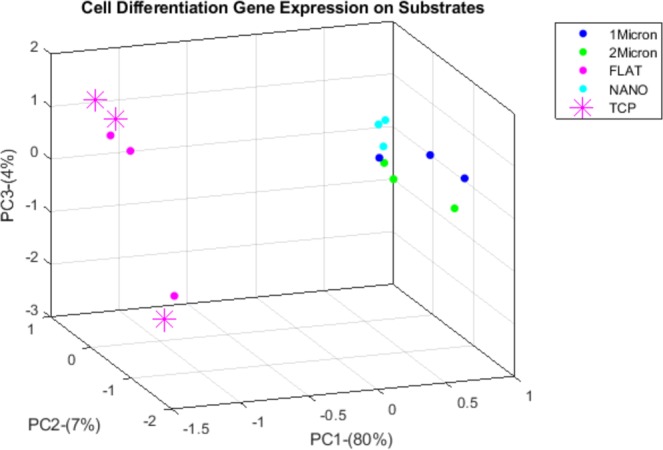
Figure 5.

Principal component plot of cell differentiation related gene expression. Differentially expressed gene transcripts related to cell differentiation of cells cultured on TCP, flat, 1 μm, 2 μm and 800 nm silk films (3 samples from each substrates) were used to perform PCA plot of the first three principal components. Profiles group in a similar manner to the hierarchical clustering—the three patterned substrates tend to cluster together.
