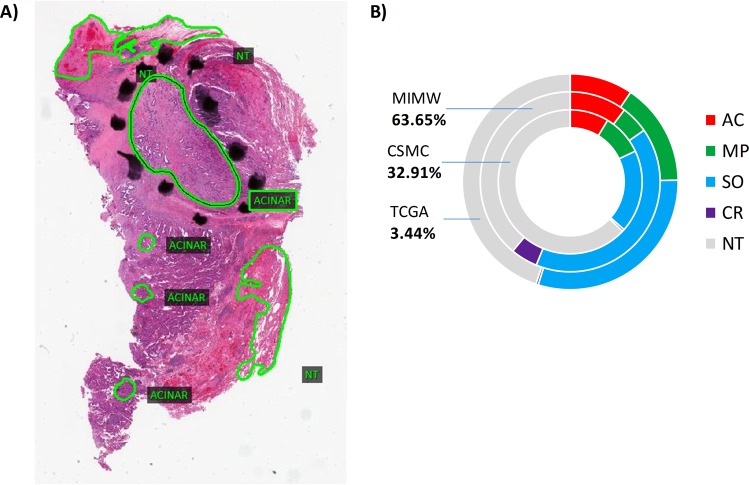
Figure 2.
Ground truth annotations in validation and test (n = 128) slides: (A) example of manual delineations (green line) and labeling performed by a pathologist using Aperio digital slide viewer. Pixels under each annotation were sorted into five tissue classes and then counted to reflect proportions shown in (B). The total number of annotated pixels originating from tumors is closely matched by the number of pixels from non-tumor areas (53% to 47%). Solid growth patterns comprised 62% of total tumor pixels. 18.3% of the tumor pixels were of acinar, 12.8% of microcapillary and 6.1% of cribriform growth. Most of the annotations come from the MIMW (43 slides) while the CSMC and TCGA contributed 58 and 27 slides, respectively.

