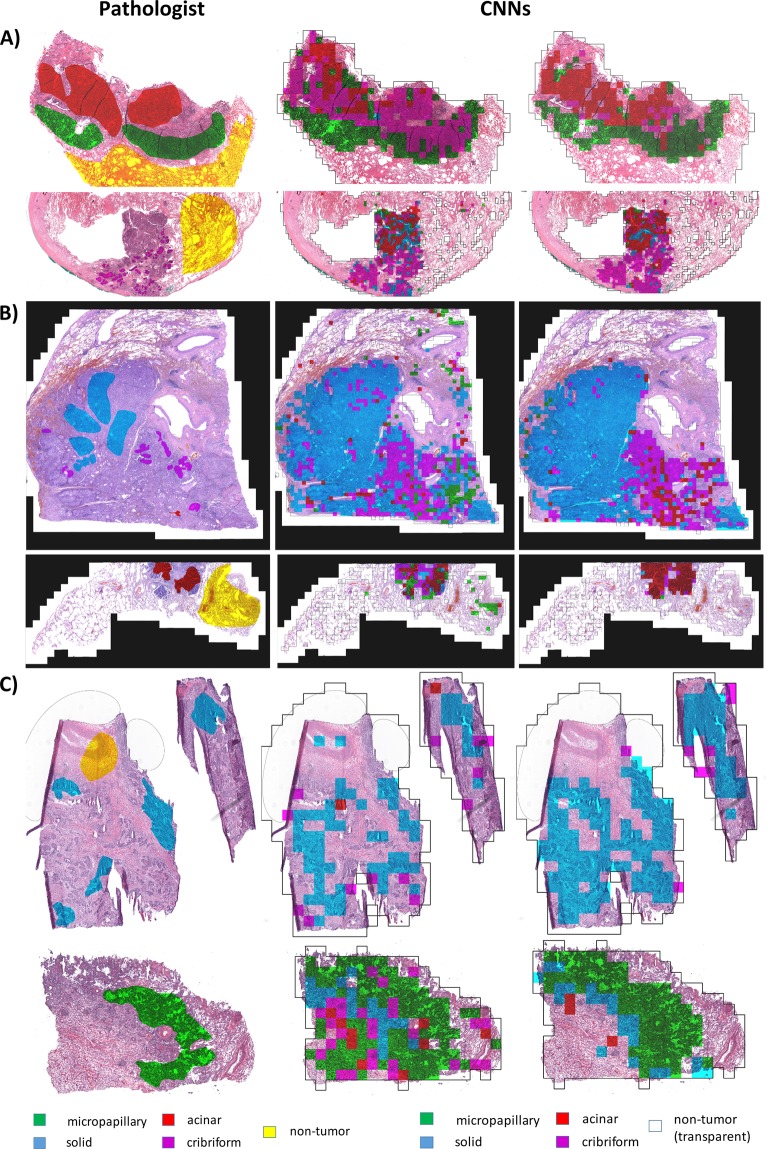
Figure 5.
Classification of LAC tumor growth patterns in digital slides. Slides classified by CNNs are outputted as colored maps showing the growth pattern and location of solid, micropapillary, acinar, and cribriform tumor growth patterns. Middle column: maps outputted by FT-AlexNet, right column: maps outputted by DN-AlexNet. Reference annotations by pathologists are shown in the leftmost column. Example slides are from (A) CSMC, (B) MIMW and (C) TCGA cohorts. Pathologist’s annotations and computer-generated maps were overlaid to calculate measures of CNN performance.

